1.0 Introduction
The Analytics Panel is the central hub of Insights, giving you a streamlined view of data trends, exportable reports, and AI-powered summaries.
2.0 Analytics Panel
Use these steps to access all of the functionality within the Analytics Panel:
1. Open the Analytics Panel:
- Click any road link to display the Analytics Panel
2. Resize the Panel:
- Drag the bottom edge to adjust vertically
- Drag the side edge to adjust horizontally
3. Moving the Analytics Panel:
- Click and drag the top header to reposition the panel anywhere on the screen
4. View Directional Data:
- Use the dropdown menu in the top-left corner to select a direction of travel
- Options vary by roadway:
- One-way / median-separated roads: one direction only
- Bi-directional roads: Aggregated, Direction A, or Direction B
5. Generate an AI Summary:
- Click the AI Summary button (top-right) to generate a summary for the current direction of travel
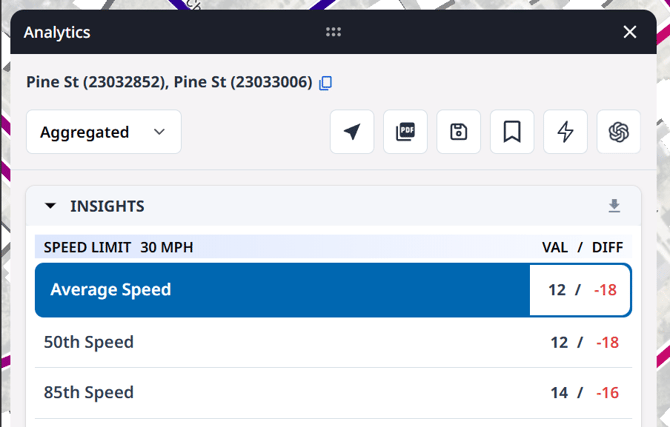
6. Review Insights:
- The Insights scorecard (top of the panel) summarizes overall metrics for the selected time period
7. Review Trends:
- The Trends section displays a heat chart of data by day of week and time period
- Values are based on the time range set in the Time Dropdown in the top action bar
8. Review Details:
- The Details section shows roadway metadata for the selected link
9. Edit Speed Limits:
- In the Details section:
- Locate the Speed Limit row
- Click the Edit (✏️) icon next to the speed value
⚠️NOTE: you can batch edit speed limits by selecting multiple links and editing them together in the Analytics Panel.
10. Export a PDF:
- Click the Export PDF button (top-right)
- The PDF includes only the data currently visible in the panel
- The map image is captured from your viewport (without the panel)
⚠️NOTE: Adjust your viewport before exporting to ensure the PDF shows the desired study area
11. Save Area:
- Click the New Area button (top-right) to save the location associated with the analytics
- Saved areas can be reused in reports and workflows
12. Create a Workflow:
- Click the Create Workflow button (top-right)
- You’ll be prompted to save the location as an area
- The saved area becomes the workflow location, and you’ll be guided to the workflow criteria page to set:
- Notification frequency
- Rules and Conditions
- Workflow Name
13. Bookmark Area:
- Bookmark a location to drop a visual pin on the map
- Add bookmarks through the Layer Manager
- Bookmarks are visual markers only and do not include analytics