![UrbanSDK_primary_logo_horizontal_white.png]](https://urbansdk-9267502.hs-sites.com/hs-fs/hubfs/UrbanSDK_primary_logo_horizontal_white.png?height=40&name=UrbanSDK_primary_logo_horizontal_white.png)
Step 1: Access Drop-down
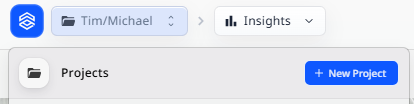
Log in and click on the Projects drop-down in the top-left corner
Step 2: Start New Project Wizard
Click “+ New Project”
Step 3: Select Project Type
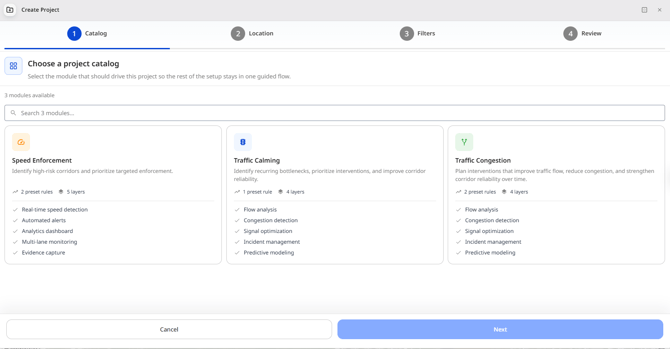
A modal will appear, and you can select the type of project - Traffic Calming, Traffic Control, or Speed Enforcement.
Step 4: Select Project Location
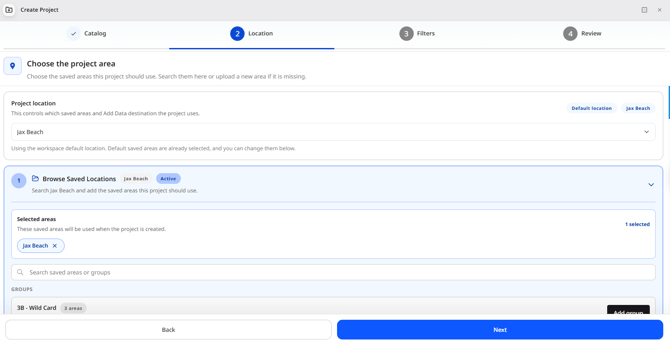
Once a module is selected, a new screen will display. From here, you can assign a location to the Project. These locations are found in the drop-down. Selecting a new location will display a different listing of Groups.
NOTE: The hierarchy for Projects dictates what appears - Project > Location > Group. A Project must have a Location with Groups in order to provide data for analysis.
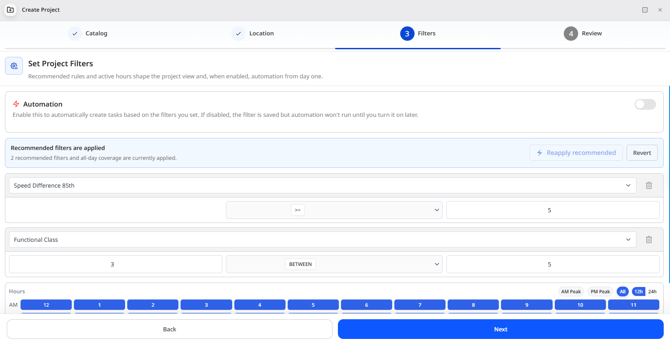
Step 5: Select Project Filters
Once the location has been selected, users can now select the different parameters by which their project is measured, and what times they want to monitor. For example, a speed enforcement project might look at 85th Percentile Speed greater than 5 miles an hour over the speed limit for the time of 7 AM to 7 PM.
Step 6: Review Project Settings
Users can now name their Project and provide the contact information for stakeholders/other users who require automated project summaries and notifications about automatically created tasks.
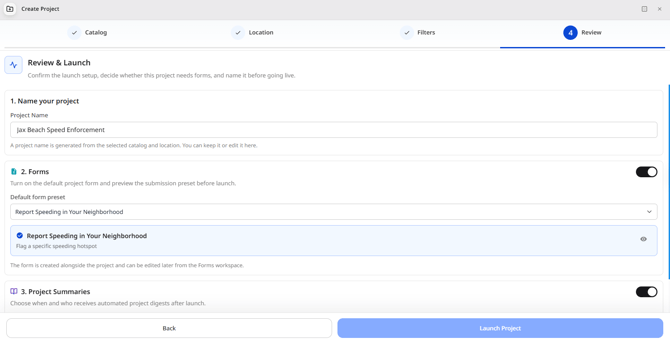
Step 7: Launch Project
Click “Launch Project” and start working on the task!
Project View
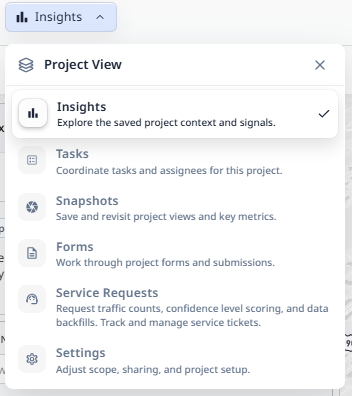
Above the toolbar is a selector where users can select the project but also the project view. Included here are the following options:
- Insights - where a large majority of work is done, viewing the map and data to determine action steps.
- Tasks - users can view a list of all tasks in the project, including those already completed
- Snapshots - users can view all snapshots created in the project for quick access and viewing
- Forms - users can view all forms and external submissions, including previously received submissions and completed forms
- Service Requests - users can view all previous service requests and submit new requests, including traffic counts and data backfills
- Settings - users can update and change project settings