1.0 Introduction
Quickly review and filter the underlying data in your report with the Data Table View.
2.0 Data Table View
Follow these steps to use access the Data Table View within Insights:
- Open the tool:
- Click the Data Table button in the Insights Tool Bar
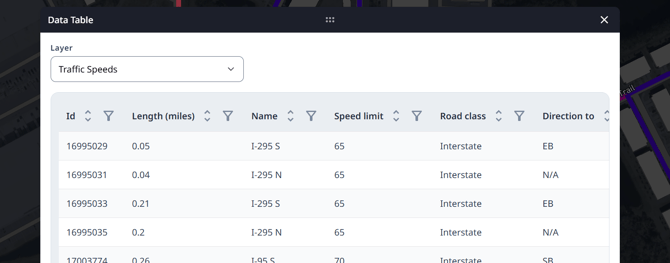
- Explore the table:
- The Data Table displays all fields and values associated with your current Insights layer
- Filter a Field by a Value:
- Each column has a filter icon at the top
- Click the icon to enter criteria and filter the table by specific values
- Review filtered results:
- The table updates automatically to show only the rows that match your filter criteria
- You can apply multiple filters across different fields for more detailed analysis