1.0 Introduction
The hover tooltip provides quick analytics when you move your cursor over a map feature. It’s designed for fast, at‑a‑glance insights without opening the full panel.
⚠️NOTE: For bi‑directional roads, the tooltip only displays aggregated data. To view directional data (e.g., Direction A vs. Direction B), open the full Analytics Panel.
2.0 Hover Tooltip
Follow these steps to explore tooltip functionality:
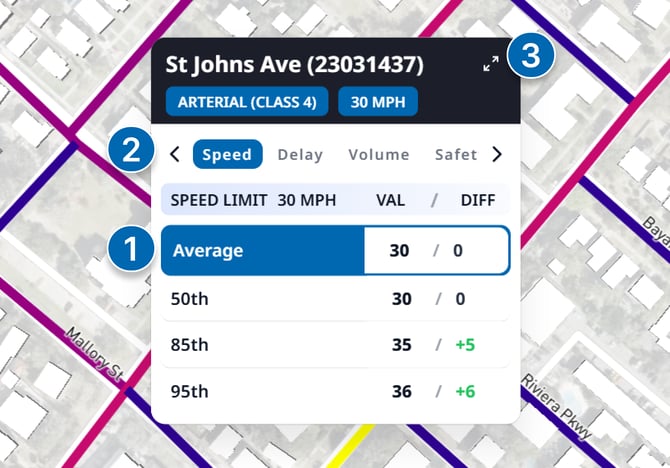
1. Review Insights
- Hover over a road link to highlight it and view metrics from the active map layer
2. Change Metrics Category
- Use the metrics category selector to switch between different types of metrics for the highlighted link
3. Open Analytics Panel
- Click the Expand button (top‑right of the tooltip) to open the full Analytics Panel for detailed analysis