1.0 Introduction
Insights enable you to re-arrange the visual hierarchy of multiple layers in your analysis, as well as adjust layer-level aggregation visualization.
2.0 Layer Options
You can make the following adjustments to each layer added to Insights:
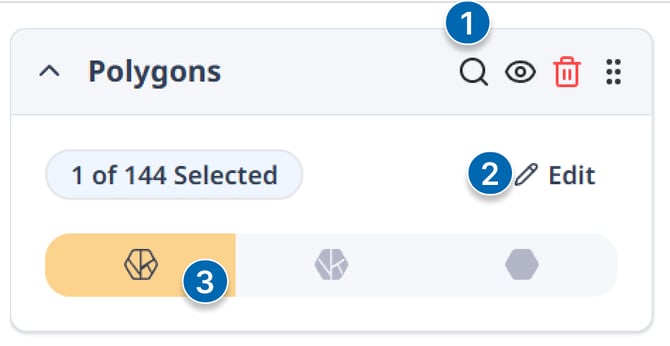
- Buttons:
- Fly-To: Flies to the layer on the map
- Visibility: Turns the layer visibility on/off
- Delete: Removes the layer from the map.
- Area Selection:
- Select which areas within the Layer Group are included in the layer
- The number of selected areas within the group are shown on the layer
- Layer Aggregation:
- Choose a visualization mode:
- Detailed: Shows the most granular segment-level data
- Hybrid: Shows segment-level data with an underlying zone or route-wide color to represent overall aggregated values.
- Aggregated: Combines all data within the area or route into a single aggregate value.
- Choose a visualization mode:
⚠️NOTE: Layers shown in the layer panel represent layer groups, not individual areas. When you add a single area to the map, its layer name will match the group it belongs to.
Example: If an area called “Zone 1” is saved in the “School Zones” group, the layer added to the map will be titled “School Zones.”