Instructions:
Uploaded Layers
- Click the "+" button adjacent to the Location dropdown in the top action bar
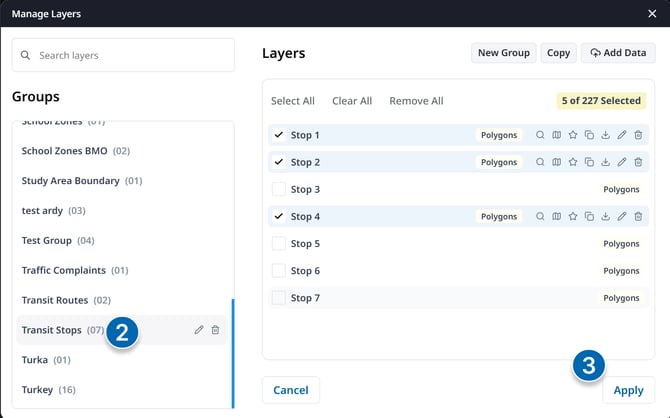
- In the Layer Manager, search within the ‘My Layers’ group
- Select the Layers you want to add to the map and click 'Apply' to add to the map
- The layers will be visible on the map and within the Layer Dropdown

Outcomes:
Selected My Library and Analysis layers are added to the map for comprehensive visualization and analysis.