![UrbanSDK_primary_logo_horizontal_white.png]](https://urbansdk-9267502.hs-sites.com/hs-fs/hubfs/UrbanSDK_primary_logo_horizontal_white.png?height=40&name=UrbanSDK_primary_logo_horizontal_white.png)
Hover Over a Road Link to View Tooltip
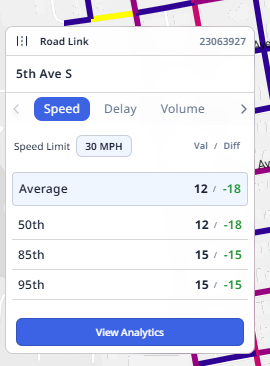
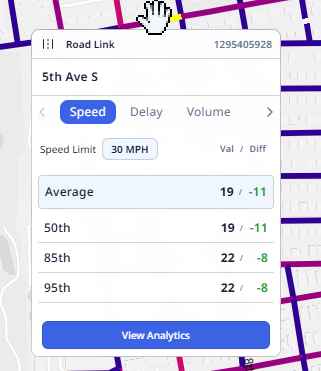
The functionality of Urban SDK as a Linear Referencing System (LRS) allows for different road segments to be selected. Based on the data our system uses, different roads are broken up into different segments. In order to view more specific data for a particular segment, users can hover over the link and an Analytics tooltip will display for users to see data at a glance.
Select a Single Road Link to Open Analytics Panel
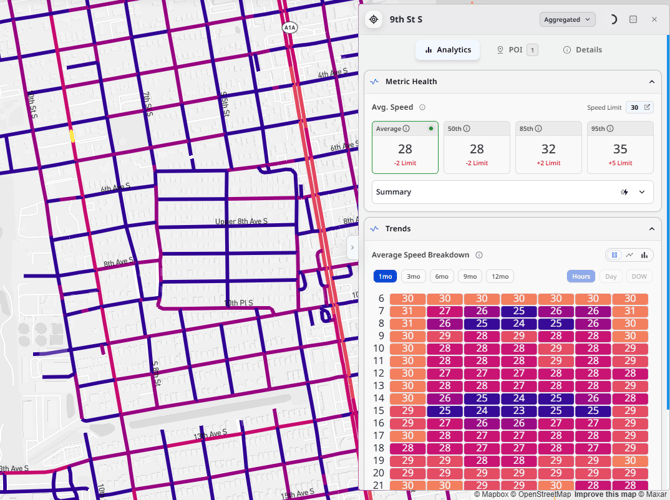
If users want to see more detailed data for a particular road segment, they can click on the segment in question to open the Analytics panel for that segment. The selected road segment is highlighted in yellow, and various information can be viewed in the displayed panel.
View Analytics for One or More Road Links Using the Selection Tool
Pointer
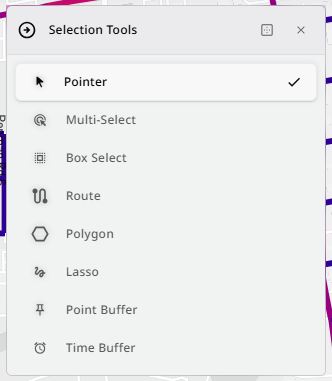
The pointer tool allows you to select individual segments to view the analytics. Only one segment can be selected at a time with this tool.
Screenshots: Pointer Tool UI
Multi Pointer
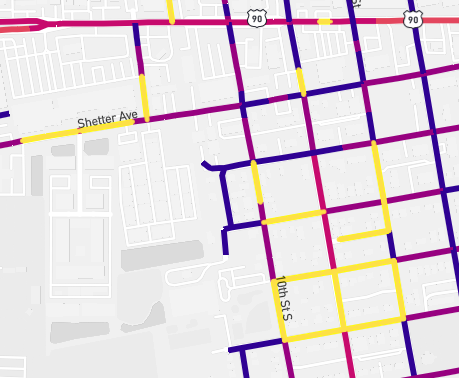
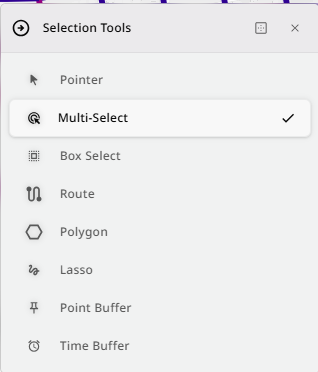
The multi pointer tool allows you to select multiple road segments in an area. Multiple segments on different roadways can be selected with this tool. If a user wants to view a specific area but exclude certain roads, this would be an ideal tool to use.
Screenshots: Multi-Select UI
Box
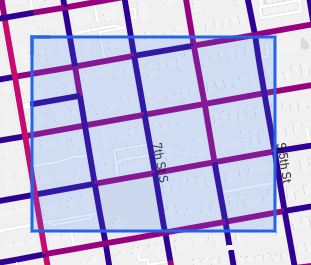
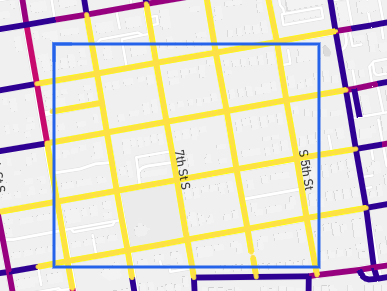
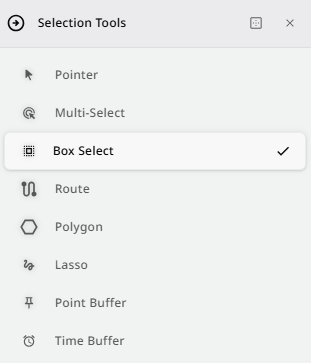
The box tool allows you to select all segments within a 4-sided polygon with 90 degree angle corners (a square or a rectangle). Once completed, all segments that touch or are within the borders of the box will be selected for analysis and viewing.
Screenshots: Box Selection UI
Route
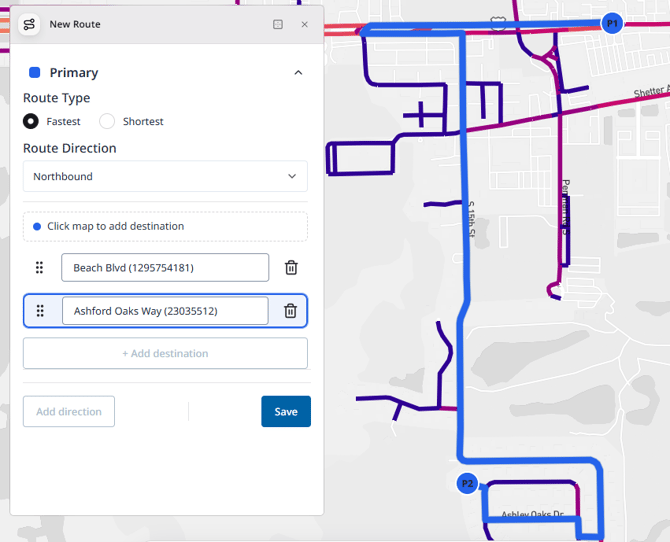
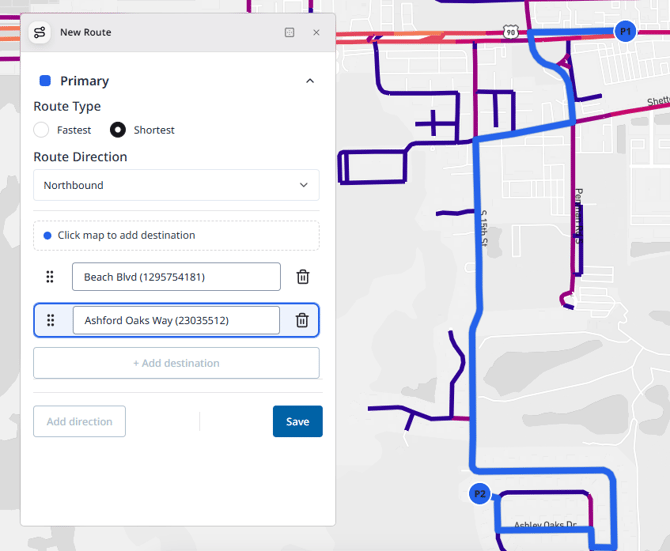
The route tool allows you to enter various locations and view the fastest or shortest routes between those locations. Locations can be moved around, and a cardinal direction (Northbound, Southbound, Eastbound, Westbound) can be selected to adjust the route. The fastest route will direct a user along a route that will allow them to travel between points in the fastest amount of time. The shortest route will direct a user along a route that will allow them to travel between points in the shortest amount of distance traveled.
Screenshot: Route UI
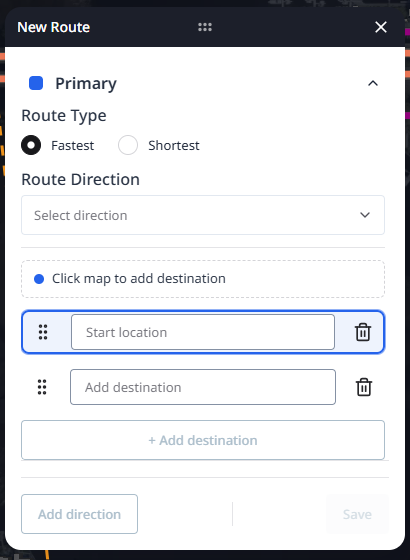
Screenshot: Fastest Route UI
Screenshot: Shortest Route UI
Polygon
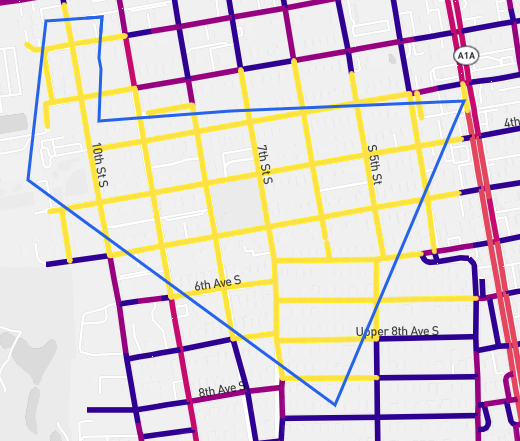
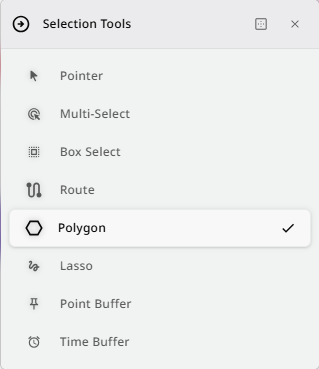
The polygon tool allows you to draw a polygon that selects all segments within the shape drawn. Any number of points and sides can be created, and once complete all segments touching or within the borders of the polygon will be selected for analysis and viewing.
Screenshots: Polygon UI
Lasso
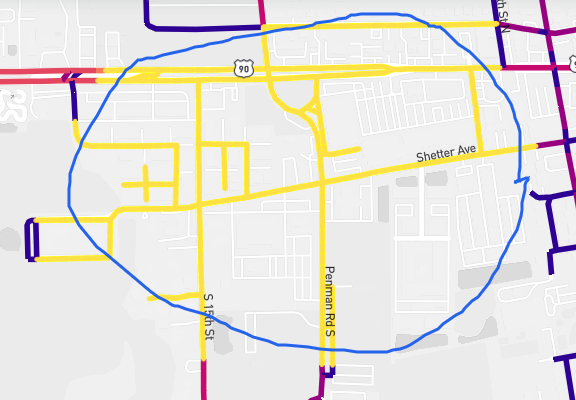
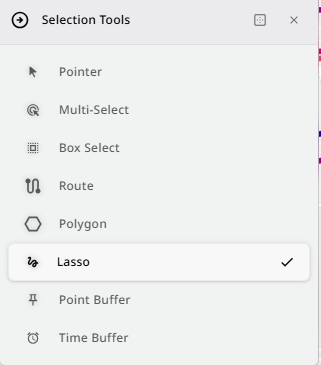
The lasso tool allows users to draw a freehand shape that selects all segments that intersect with or are contained within its boundaries. This tool offers more freedom in terms of omitting a certain area from a selection.
Screenshots: Lasso Tool
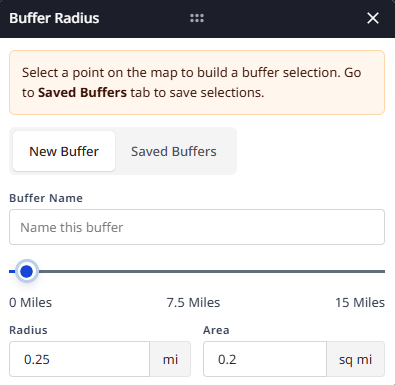
Point Buffer
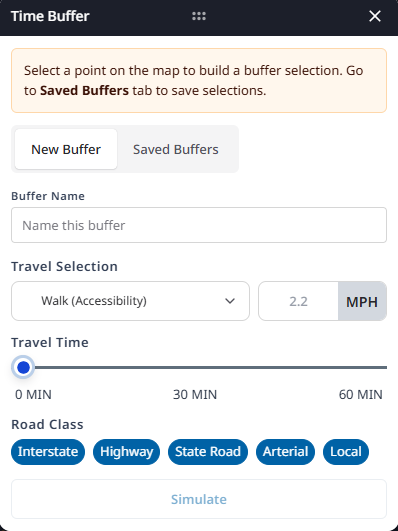
Time Buffer
Saving a Selection as a Location
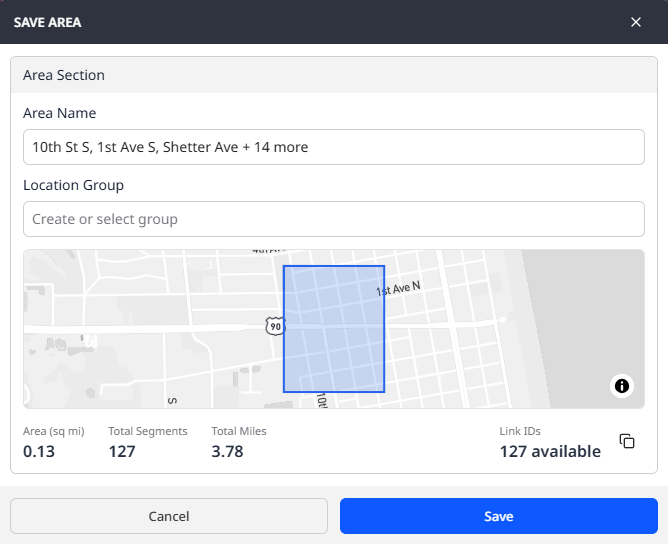
If the selection made is an area that will be referenced in different reports or projects, users have the option to save that area as a location that can be added to a project or as a layer to an existing project. This allows for the creation of specific zones for monitoring, such as school zones, high-traffic event locations (such as a fairground that sees major traffic events only a few times a year), and other specialized areas not otherwise readily viewable in the LRS.
To save an area as a location, simply:
- Use the selection tool of choice and complete the shape/selection
- Click the ‘Save Area’ button.
- In the dialog that appears, enter a name for the Location and select or create a Location Group for the location.
- Click “Save”

Updates to Road Segments
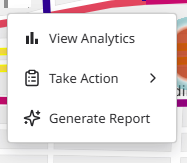
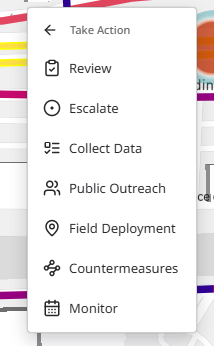
Users can now right-click on a road segment and immediately add a task from the Insights module. If users see an issue in the Insights module, they no longer have to navigate to the Tasks module and create a task. They can simply select the road segment they want and add a task right from the map.