![UrbanSDK_primary_logo_horizontal_white.png]](https://urbansdk-9267502.hs-sites.com/hs-fs/hubfs/UrbanSDK_primary_logo_horizontal_white.png?height=40&name=UrbanSDK_primary_logo_horizontal_white.png)
Tasks Button
Opens up the Tasks panel; users can view all tasks within a specific area or filter by status.
Forms Button
Opens up the Forms panel; users can view all forms within a specific area or filter by status.
Locations Button
Opens a dialog where users can add areas and locations to the Insights view.
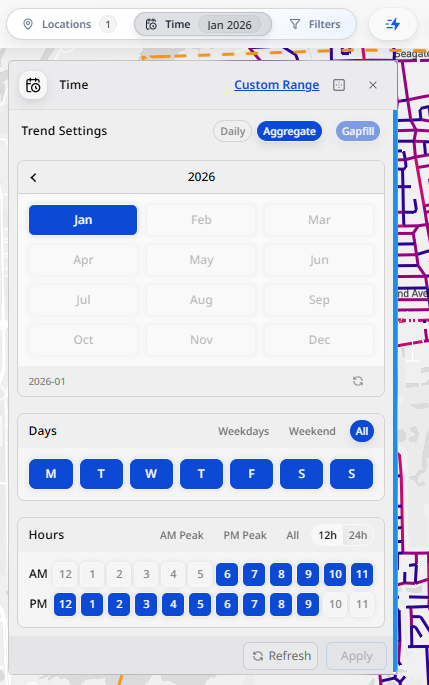
Time Button
Opens a dialog where users can filter by time (by hour, segment of time (e.g. AM Peak), month/year, or day of the week).
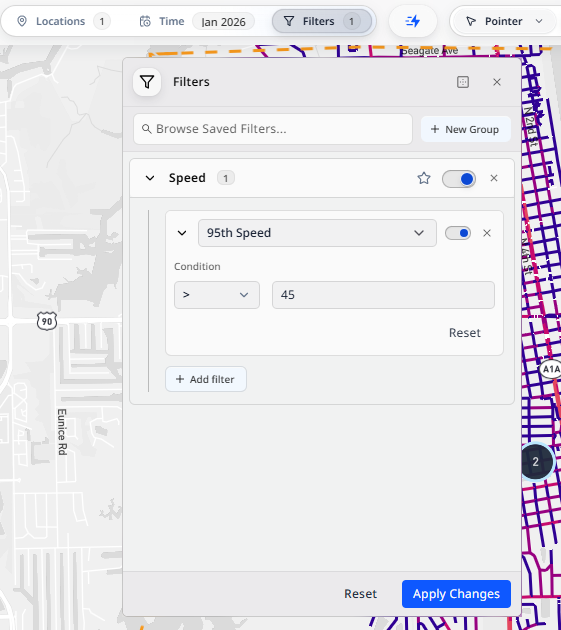
Filters Button
Opens a dialog where users can create filter groups and filter day based on selected parameters.
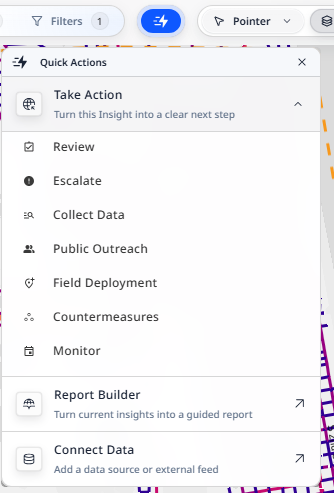
Quick Actions Button
Opens a dialog where users can create Tasks, build Reports, or connect external data.
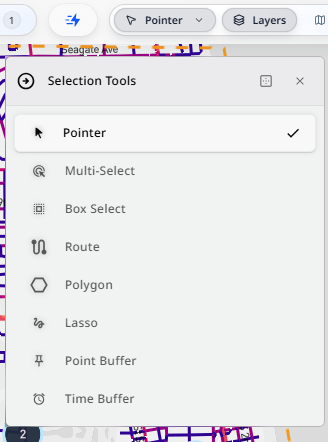
Selection Button
Opens a dialog where users can choose which selection type they would like to use. Options include:
- Pointer
- Multi-pointer
- Box
- Route
- Polygon
- Lasso
- Point Buffer
- Time Buffer
Layers Button
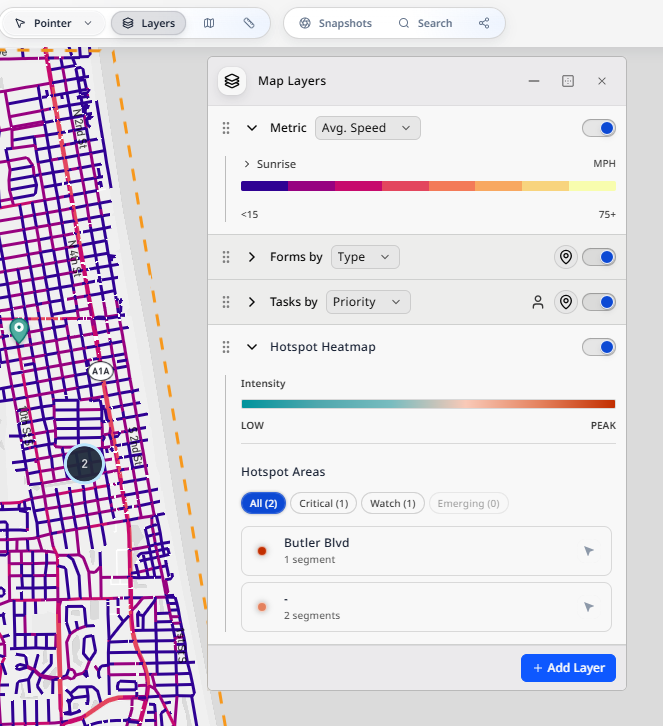
Opens the Layers panel, where users can add new layers and toggle layer views, including a heatmap, tasks, forms, etc.
Map Settings
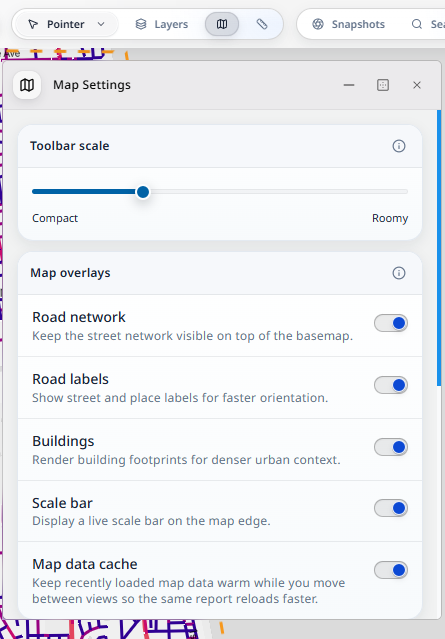
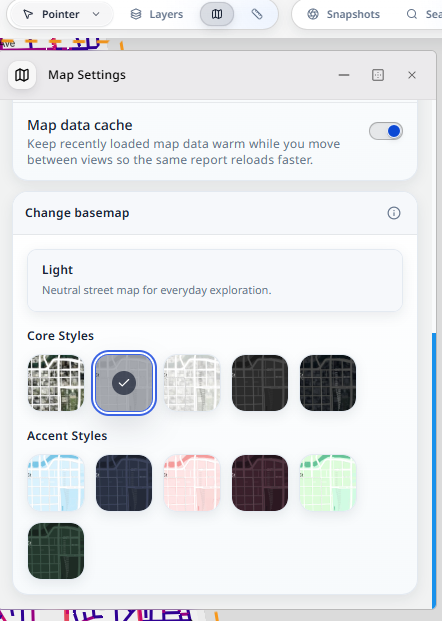
Opens a dialog where users can customize the settings for the map, including scale, labels, map style, etc.
Ruler Button
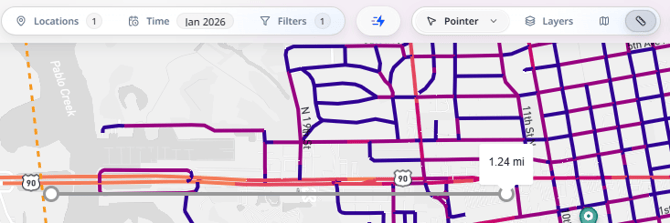
Opens the Ruler, allowing users to click a point on the map and determine the distance between another point.
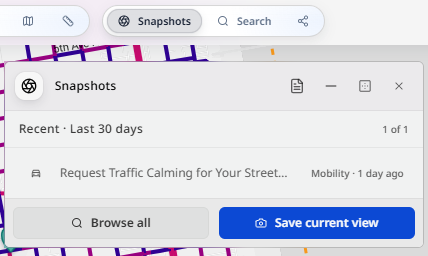
Snapshots Button
Opens a dialog where users can select from existing snapshots to view, search for snapshots, or create a snapshot from the currently selected data.
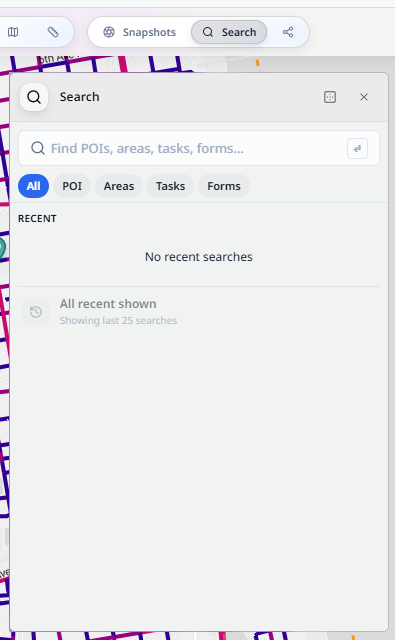
Search Button
Opens a dialog where users can search for places of interest, areas, tasks, and forms within the current project.
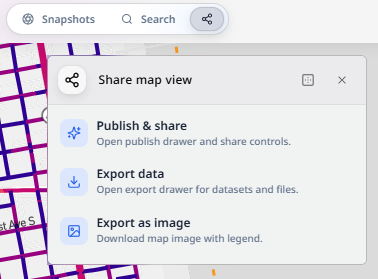
Share Button
Opens a dialog where users can share the selected map view with external users, whether as a link, as a file (csv, geojson, or ShapeFile), or as an image with an attached legend.
Locations
Turning on/off a Location
Step 1: Access Locations
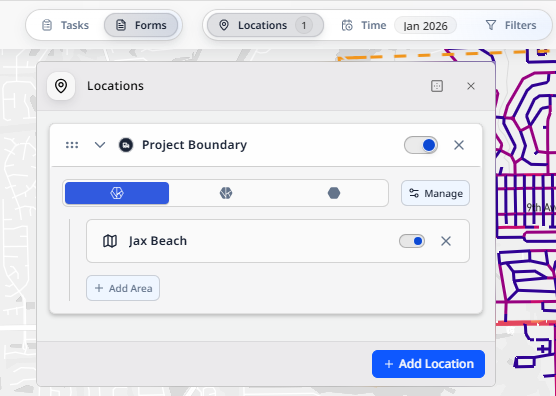
From the Insights module, click on “Locations” in the Toolbar.
Step 2: Update Toggles
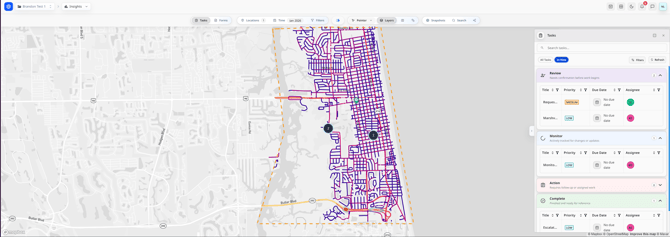
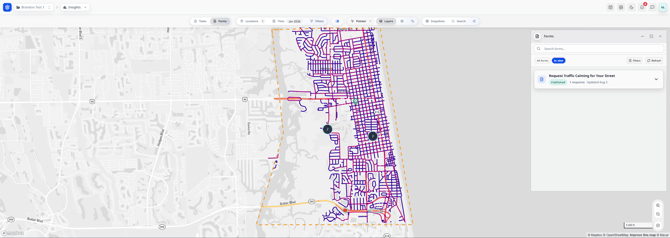
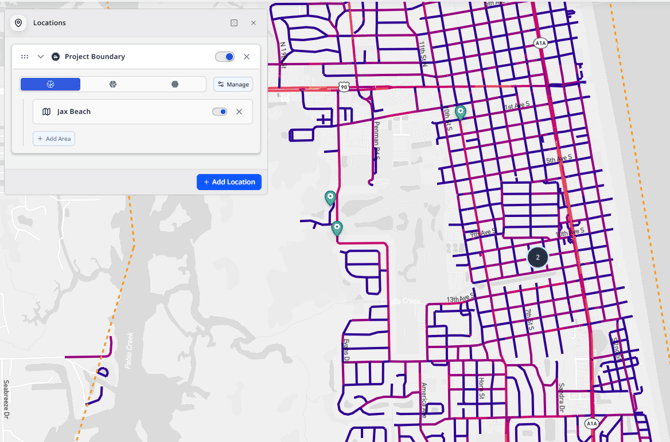
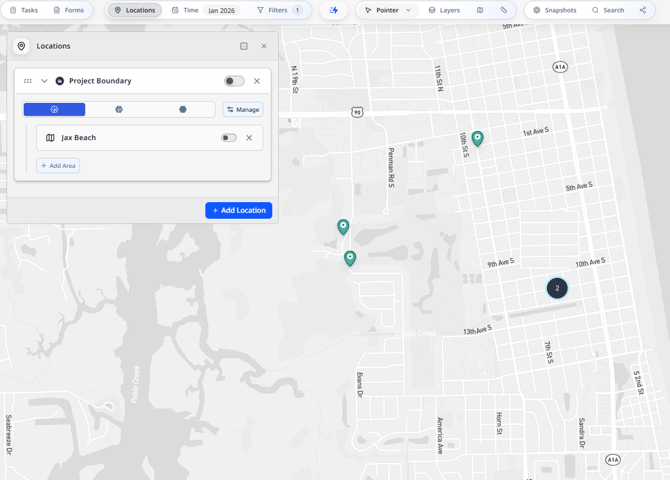
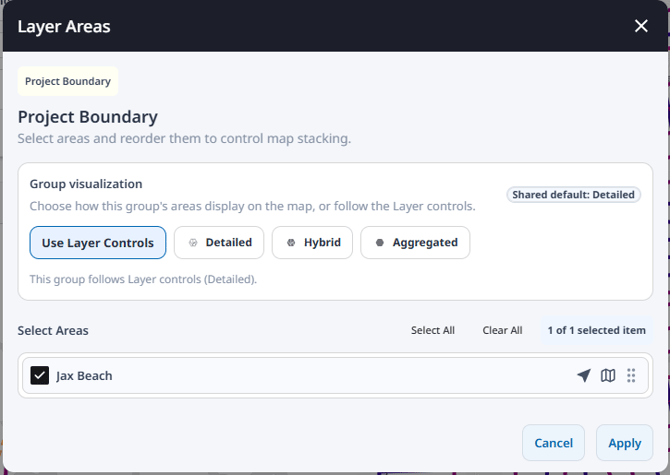
To view the map without the location selected, a user can toggle the Boundaries option, or they can un-check the checkbox for the Location (in the picture below, Jax Beach). The pictures display the Insights map with the Location toggled on and off.
Step 3 (Optional): Add Areas
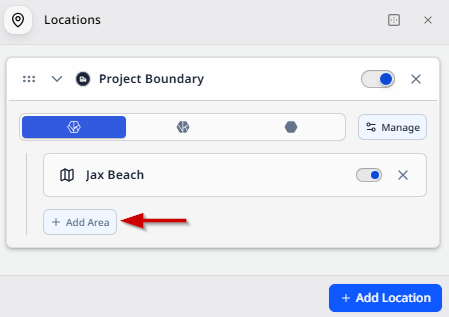
If a user would like to view additional areas, they can do so by clicking on the “+ Add Area” button and selecting the options visible in the modal that is displayed.
Add or Upload a Location
Step 1: Click Add Location Button
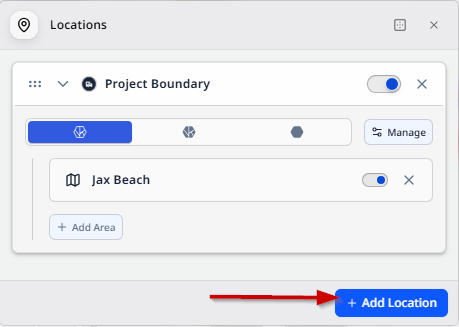
If you would like to add additional locations to view, you can create a new Location layer. This layer can be toggled on/off and has settings configured on creation. Users can select an existing Location layer, or add new data for creation of a Location layer.
Step 2: Upload Location Data
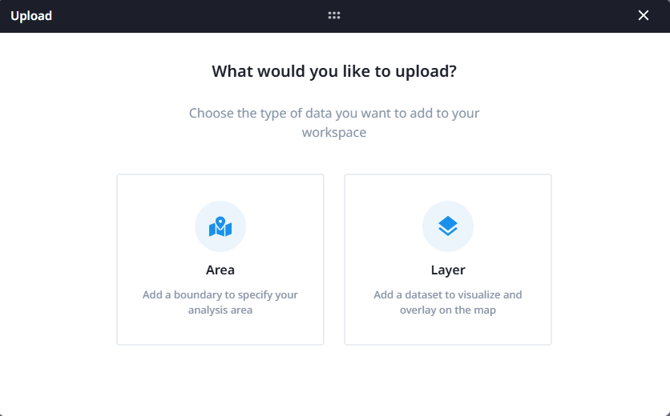
Uploading a Location is done by clicking the “Add Data” button. From there, users can upload either an area or a layer. Areas are boundaries used to specify a specific area of analysis. A Layer is a dataset used to visualize data and overlaid on the map. An Area would be something like Mandarin within the greater Location of Duval County. A Layer would be something like school zones in Mandarin.
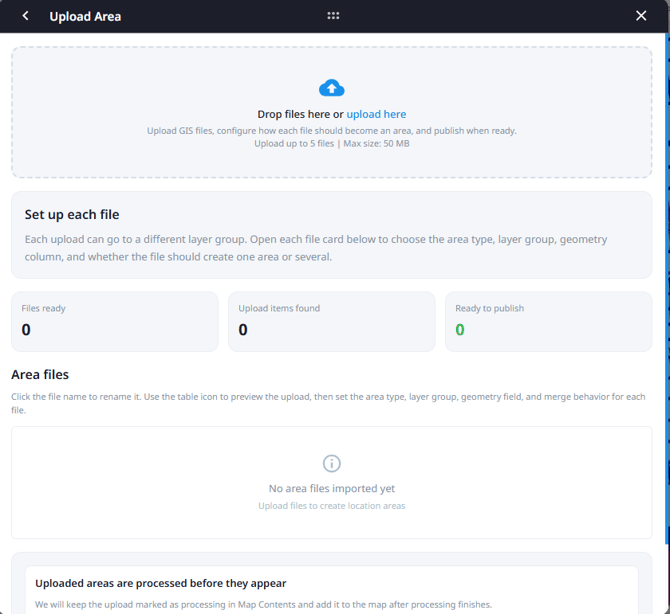
Step 2a: Select files to Upload an Area
Uploading an Area displays the modal below. Users can upload GIS files (a maximum of 5 files or 50 MB in size) such as a GeoJSON or Shapefile. Each file can then be assigned to a different layer group.
Step 2b: Select files to Upload a Layer
Uploading a Layer displays the modal below. Users can upload GIS files (a maximum of 5 files or 50 MB in size) such as a GeoJSON or Shapefile. Each layer can then be added to the current map.
Time
Selecting Daily or Aggregated
Depending on data needed, users can filter their map via daily or aggregated times.
Step 1: Select Time Filter
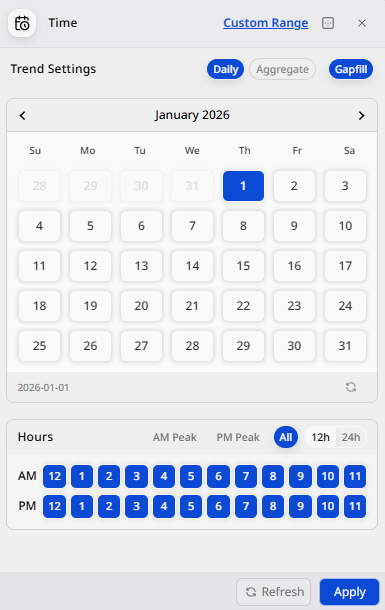
Select the Time Filter, and select which view you’d like to see. Daily allows you to see the data for a selected day and for hourly intervals. Users can also select from common time filters such as the AM Peak, PM Peak, or all hours.
Step 2: Select Daily/Aggregated and Other Date Settings
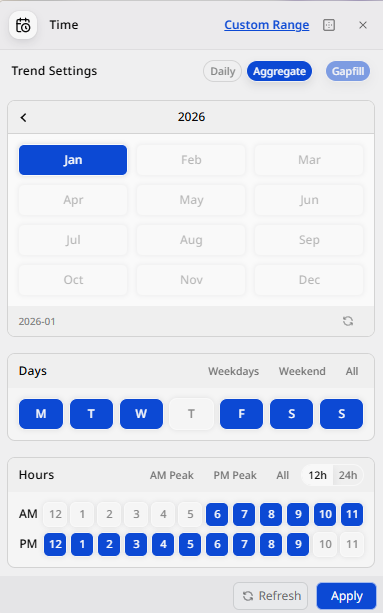
For aggregated views, select the “Aggregate” button. From here, users can select a year, month, day, and time to filter their data. Users can select up to all 7 days in the week, and up to each hour in the day. Users can also select from common filters such as Weekdays or Weekend and AM Peak or PM Peak.
Filters
Turn a Filter Group On/Off
Step 1: Open Filters Panel
Select the Filters option in the Toolbar
Step 2: Toggle Filter Groups
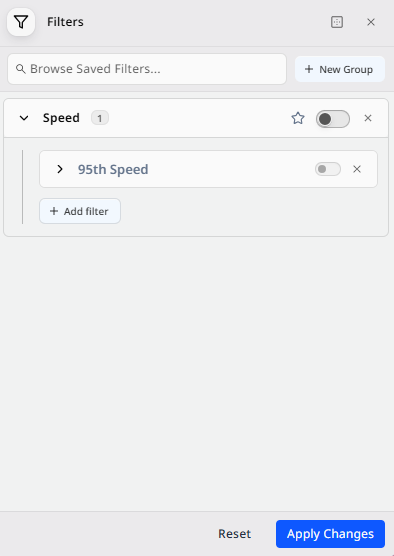
Press the Filter Group toggle. In the picture below, the filter group is named “Major Streets”. Its current state is toggled ON. Clicking it would toggle it OFF. These changes are NOT saved unless a user clicks “Apply Changes” toward the bottom of the menu.
Create a Filter Group
Step 1: Open Filters Panel
Click the “Filters” button in the toolbar.
Step 2: Add Filter Group
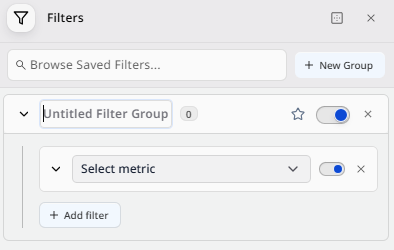
Click the “Add Group” button in the displayed menu.
Step 3: Provide Group Information
Provide a name (required) for the filter group and select filters to use in the filter group. Users can also add new filters by clicking on the “Add Filter” button. Users can add multiple filters to a filter group.
Edit a Filter Group
Step 1: Open Filters Panel
Select the Filters option from the Toolbar
Step 2: Expand Selected Filter Group
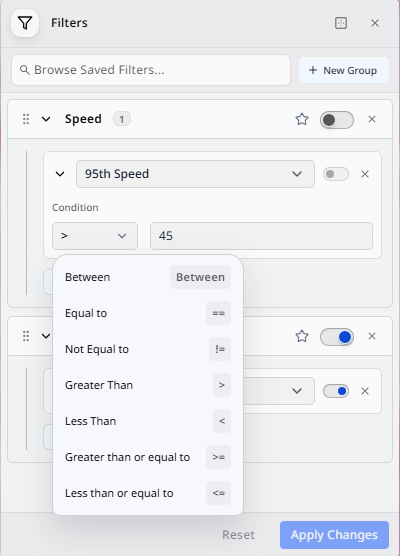
If there are multiple filter groups, click on the expander arrow for the filter group you wish to edit.
Step 3: Update/Edit/Delete Parameters
From here, you can edit the parameters of the filters in the filter group, add new filters, or delete existing filters from the filter group.
Search for a Filter Group
Step 1: Open Filters Panel
Select the Filters option from the toolbar.
Step 2: Browse Filter Groups
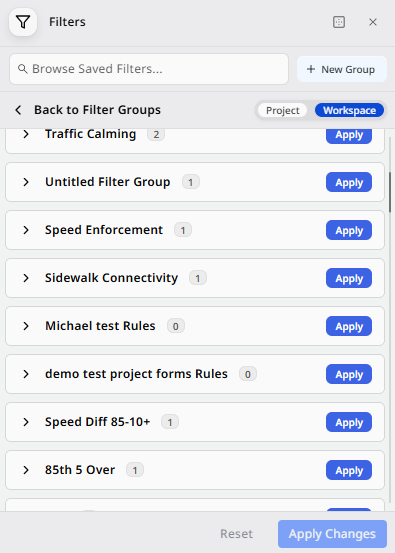
Click on the “Browse all” button.
Step 3: Search and Select Filter Groups
Select any number of filter groups to apply to the project. The listed filter groups updates in real time as users enter a value.
NOTE: The filter only searches by group name and metric name.Map Layers
Toggle Layers On/Off
Step 1: Open Map Layers Panel
From the Toolbar, click the icon that looks like 3 Kraft Singles stacked on top of one another.
Step 2: Toggle Map Layers
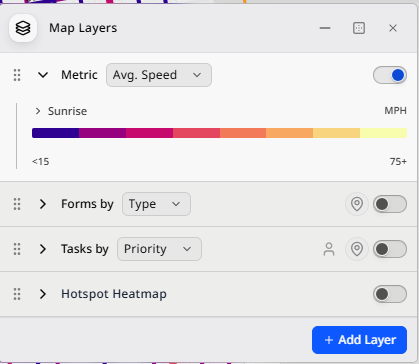
From the Map Layers menu that appears, you can now toggle different layers on or off. Toggles that are blue are ON and will appear on the map, toggles that are gray are OFF and will not appear on the map.
Change Road Metrics in Layer Panel
Step 1: Open Map Layers Panel
Open the Map Layers panel
Step 2: Open the Road Metric Layer
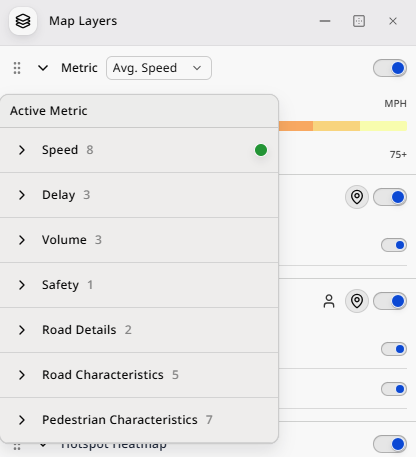
Find the Road Metric layer and click the expandable arrow next to it (seen below next to Avg. Speed)
Step 3: Select New Road Metric
Select a new Road Metric to view from the options available.
Change Legend Color of Active Road Metric
Step 1: Open Map Layers Panel
Find the Layer with the Legend you’d like to change
Step 2: Select Paint Palette Icon
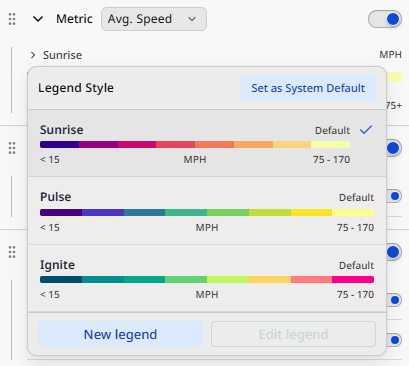
Select the legend name expandable icon
Step 3: Select New Legend
Select the new legend you’d like to use
Step 3a: (Optional) Create New Legend
If none of the existing legends appeal to you, you can create a custom legend.
Create a Custom Legend
Step 1: Select Paint Palette Icon
Select the paint palette icon to expand the legend selection
Step 2: Select ‘New Legend’
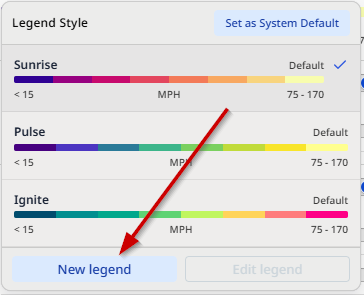
Select the “New Legend” button
Step 3: Select Details for Legend
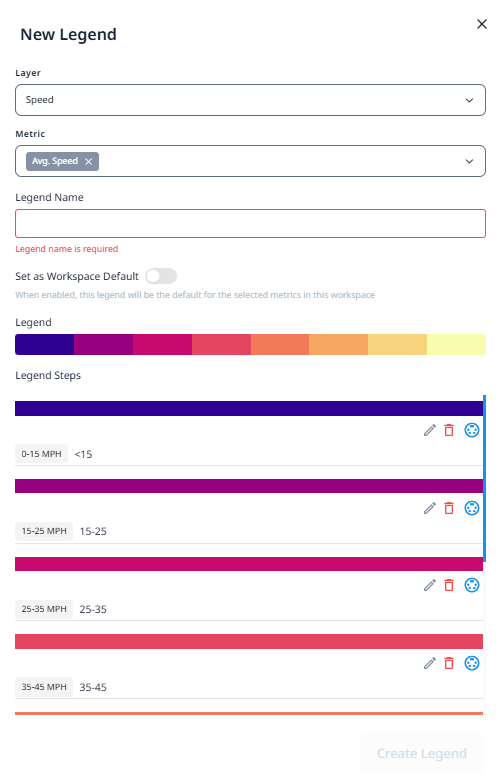
Enter in the various details for the legend, including the layer, metric, and name. The Metric selected will dictate the steps of the legend that appear below. Once you are satisfied, create the legend and you can now apply it to any relevant layer.
Hotspot Heatmap
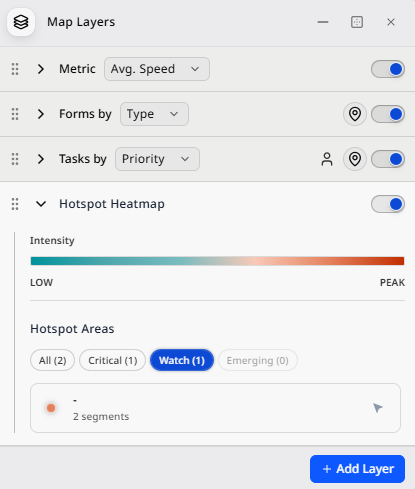
Users can now use the heatmap with more functionality to view problem areas. The specific road areas are broken down into different categories, allowing users to view areas that need the most urgent intervention. Additionally, they can click on specific segments to immediately focus on that area.
Map Settings
Adjust Toolbar Scale
Step 1: Open Map Settings
Click on the Map Settings button.
Step 2: Scale Toolbar
Scale the toolbar to the selected size.
NOTE: The toolbar can only be set to a minimum of 80% of the regular size and a maximum of 150% of the regular size.
Toggle Basemap Visuals On/Off
Step 1: Open Map Settings
Click on the Map Settings button.
Step 2: Toggle Map Overlays
Find the Map overlays section of the menu. From here, you can toggle different reference layers and map helpers on or off. Toggles that are blue are ON and will appear on the map, toggles that are gray are OFF and will not appear on the map.
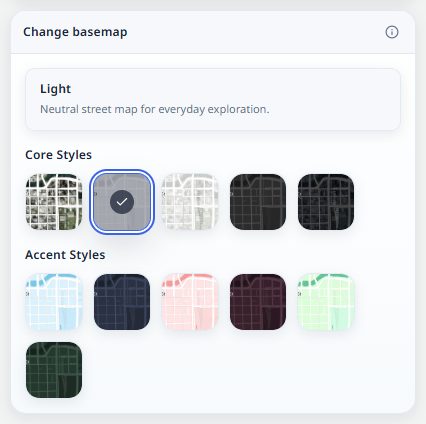
Change Basemap
Step 1: Open Map Settings
Click on the Map Settings button.
Step 2: Change basemap
Find the “Change basemap” section of the menu. From here, you can toggle select from a variety of different core styles for everyday use, analysis, and presentation. Additionally, different accent colors are also available to choose from.