![UrbanSDK_primary_logo_horizontal_white.png]](https://urbansdk-9267502.hs-sites.com/hs-fs/hubfs/UrbanSDK_primary_logo_horizontal_white.png?height=40&name=UrbanSDK_primary_logo_horizontal_white.png)
1.0 Selectable Layers
The following are Traffic Delay data layers that can be selected within Insights including:
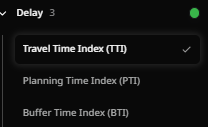
- Travel Time Index (TTI)
Quantifies the ratio of the average travel time over a road segment to the travel time over the same segment under free-flow conditions. - Planning Time Index (PTI)
Quantifies the ratio of the 95th percentile travel time over a road segment to the travel time over the same segment under free-flow conditions. - Buffer Time Index (BTI)
Quantifies the difference between the TTI and PTI and represents the extra buffer time most travelers add when planning trips to ensure on-time arrival.
⚠️NOTE: Only one layer can be selected at a time for analysis.
2.0 Map View
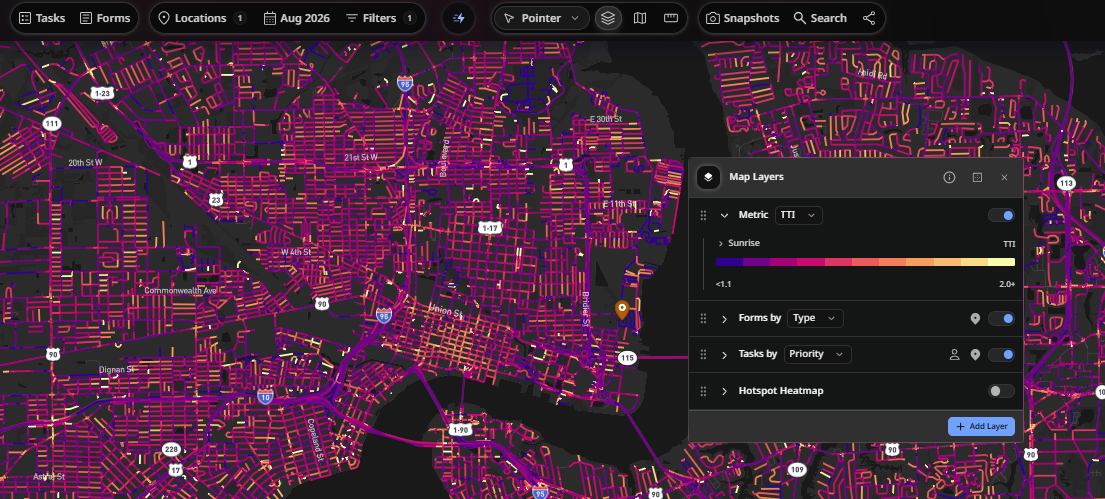
When selecting one of the Traffic Delay layers, the map will color-code the road links based on their Index value across the entire selected time period. For instance, if a customer selects to view data for the month of August 2026 and selects the Travel Time Index (TTI) layer, the colors on the road links will represent the calculated TTI across the entire month.
TTI/PTI Legend
The following categories are used to color the data according to the Traffic Delay data across the available layers:
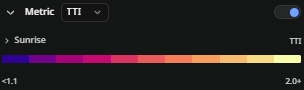
| Category | Values | Alt Name |
| 1 | 1-1.0999 | <+10% |
| 2 | 1.1-1.1999 | +10-20% |
| 3 | 1.2-1.2999 | +20-30% |
| 4 | 1.3-1.3999 | +30-40% |
| 5 | 1.4-1.4999 | +40-50% |
| 6 | 1.5-1.5999 | +50-60% |
| 7 | 1.6-1.6999 | +60-70% |
| 8 | 1.7-1.7999 | +70-80% |
| 9 | 1.8-1.899 | +80-90% |
| 10 | 1.9-1.999 | +90-100% |
| 11 | 2.0+ | 100%+ |
⚠️NOTE: Travel Time Index (TTI), Planning Time Index (PTI), and Buffer Time Index (BTI) are represented as a ratio that represents travel time and delay.