![UrbanSDK_primary_logo_horizontal_white.png]](https://urbansdk-9267502.hs-sites.com/hs-fs/hubfs/UrbanSDK_primary_logo_horizontal_white.png?height=40&name=UrbanSDK_primary_logo_horizontal_white.png)
3.0 Traffic Speed Layers
Urban SDK offers two families of speed metrics: Speed metrics describe the observed speed itself, while Speed Difference metrics describe how that speed compares to the posted limit.
Speed Metrics
- Average Speed
Quantifies the average speed of observed trips along a road segment. - 50th Percentile Speed
Also known as the median speed, where half of the observed vehicles travel at or below this speed, and half travel faster. - 85th Percentile Speed
Quantifies the speed at or below which 85% of observed trips travel along a road segment. - 95th Percentile Speed
Quantifies the speed at or below which 95% of observed trips travel along a road segment.
Speed Difference Metrics
- Average Difference: Quantifies the difference between the speed limit and average speed of observed trips along a road segment. It is provided in miles per hour (mph).
- 50th Percentile Difference: Quantifies the difference between the speed limit and the speed at or below which 50% of observed trips travel along a road segment. It is provided in miles per hour (mph).
- 85th Percentile Difference: Quantifies the difference between the speed limit and the speed at or below which 85% of observed trips travel along a road segment. It is provided in miles per hour (mph).
- 95th Percentile Difference: Quantifies the difference between the speed limit and the speed at or below which 95% of observed trips travel along a road segment. It is provided in miles per hour (mph)
Speed Metrics vs Speed Difference Metrics: A road's raw speed doesn't tell you much on its own — 40 mph is fine on a highway but a serious problem on a residential street. Since Speed Difference is always relative to each road's posted speed limit, it's often the fastest way to identify genuine problem corridors across a jurisdiction as posted speed limits vary.
NOTE: Only one Speed layer can be selected at a time for analysis.
NOTE: If you've uploaded your own speed limit data but haven't updated every street, Speed Difference will use your data wherever it's available and automatically fall back to Urban SDK's modeled posted speed limits for any streets still missing it — so Difference values remain complete across your jurisdiction even during a partial rollout.
3.0 Map View
The Map View is Urban SDK's primary visualization tool for exploring roadway conditions across your jurisdiction. Using the Map Layers panel, you can color-code every road segment by traffic speed, layer in Forms and Tasks, and surface hotspots — all filtered to the time period you select.
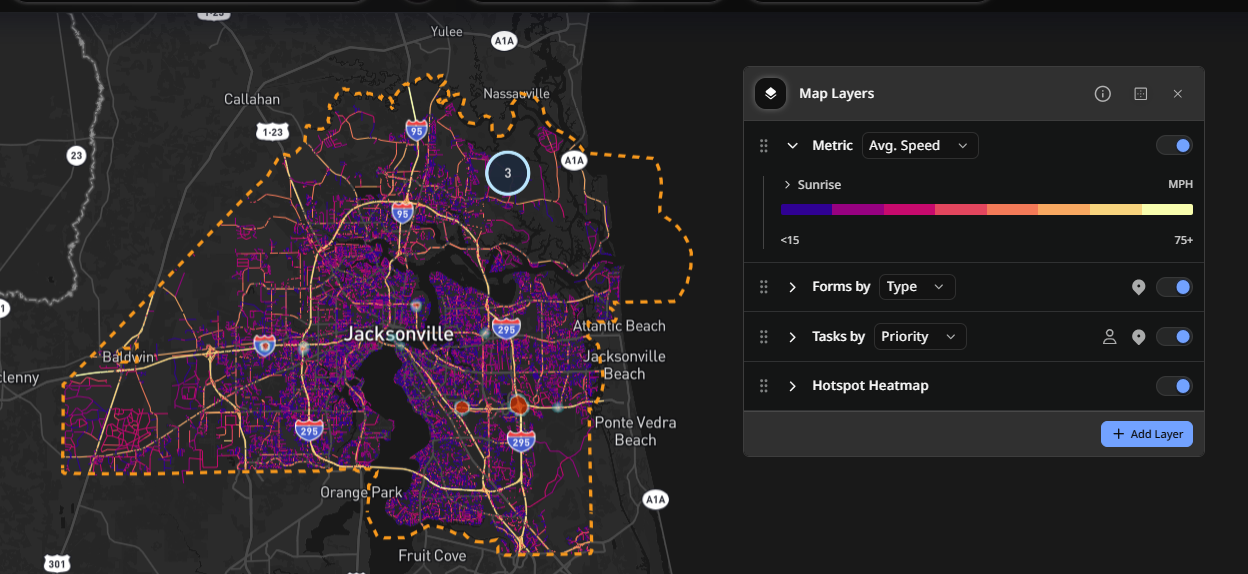
When you select a Traffic Speed metric from the Metric dropdown, the map colors every road link based on that metric's value across your currently selected time period.
For example, if you set your date range to July 2026 and choose the Average Speed metric, each road link is colored according to its average speed across the entire month — not a single day or moment in time. Change the date range (Monthly Aggregated or Daily), and the colors update to reflect that new period or particular day.
Traffic Speed Data Legend
The following categories are used to color the data according to the speed across all Traffic Speed Data layers:
Each speed layer displays a gradient legend mapping color to speed (in mph), from slowest to fastest:
<15 mph → dark blue/purple → magenta → orange → 75+ mph (bright yellow)
Cooler, darker colors indicate slower speeds; warmer, brighter colors indicate higher speeds. The scale adjusts automatically based on the data present in your jurisdiction and selected time period.
Tip: Because color reflects an aggregate across the entire selected period, a road showing orange or yellow isn't necessarily fast at every moment — it means that metric ran high across the full range you selected. To investigate a specific window (like school drop-off or rush hour), narrow your date/time filters first, then read the colors.
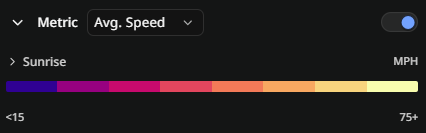
| Category | Values (mph) |
| 1 | <15 mph |
| 2 | 15-24.99 mph |
| 3 | 25-34.99 mph |
| 4 | 35-44.99 mph |
| 5 | 45-54.99 mph |
| 6 | 55-64.99 mph |
| 7 | 65-74.99 mph |
| 8 | 75+ mph |
Speed Limit Difference Legend
The following legend categories are used by default to color the data according to the speed limit difference across all Speed Limit Difference layers:
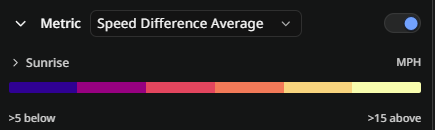
| Category | Values (mph) |
| 1 | >5 mph below |
| 2 | 0-5 mph below |
| 3 | 0-5 mph above |
| 4 | 5-10 mph above |
| 5 | 10-15 mph above |
| 6 | >15 mph above |