Add Crash Layer in Insights Reports
How to upload crashes to see crashes and speeds in the same map
The FHWA reports that US vehicle fatalities are increasing nationally. Speed-related crashes are associated with 10,192 fatalities, 498,000 nonfatal injuries, and $46 billion in economic costs in 2019, accounting for 14% of all economic costs.
With Insights, you can add Crashes and Traffic Events to any Insights report to quickly map crashes and compare 85th Percentile speeds on every roadway within your community.
This article helps you understand how to upload crash files to develop advanced reporting for safety planning, incident reporting, transportation planning, bike & pedestrian level of stress and traffic calming studies.
What's the Crash Layer?
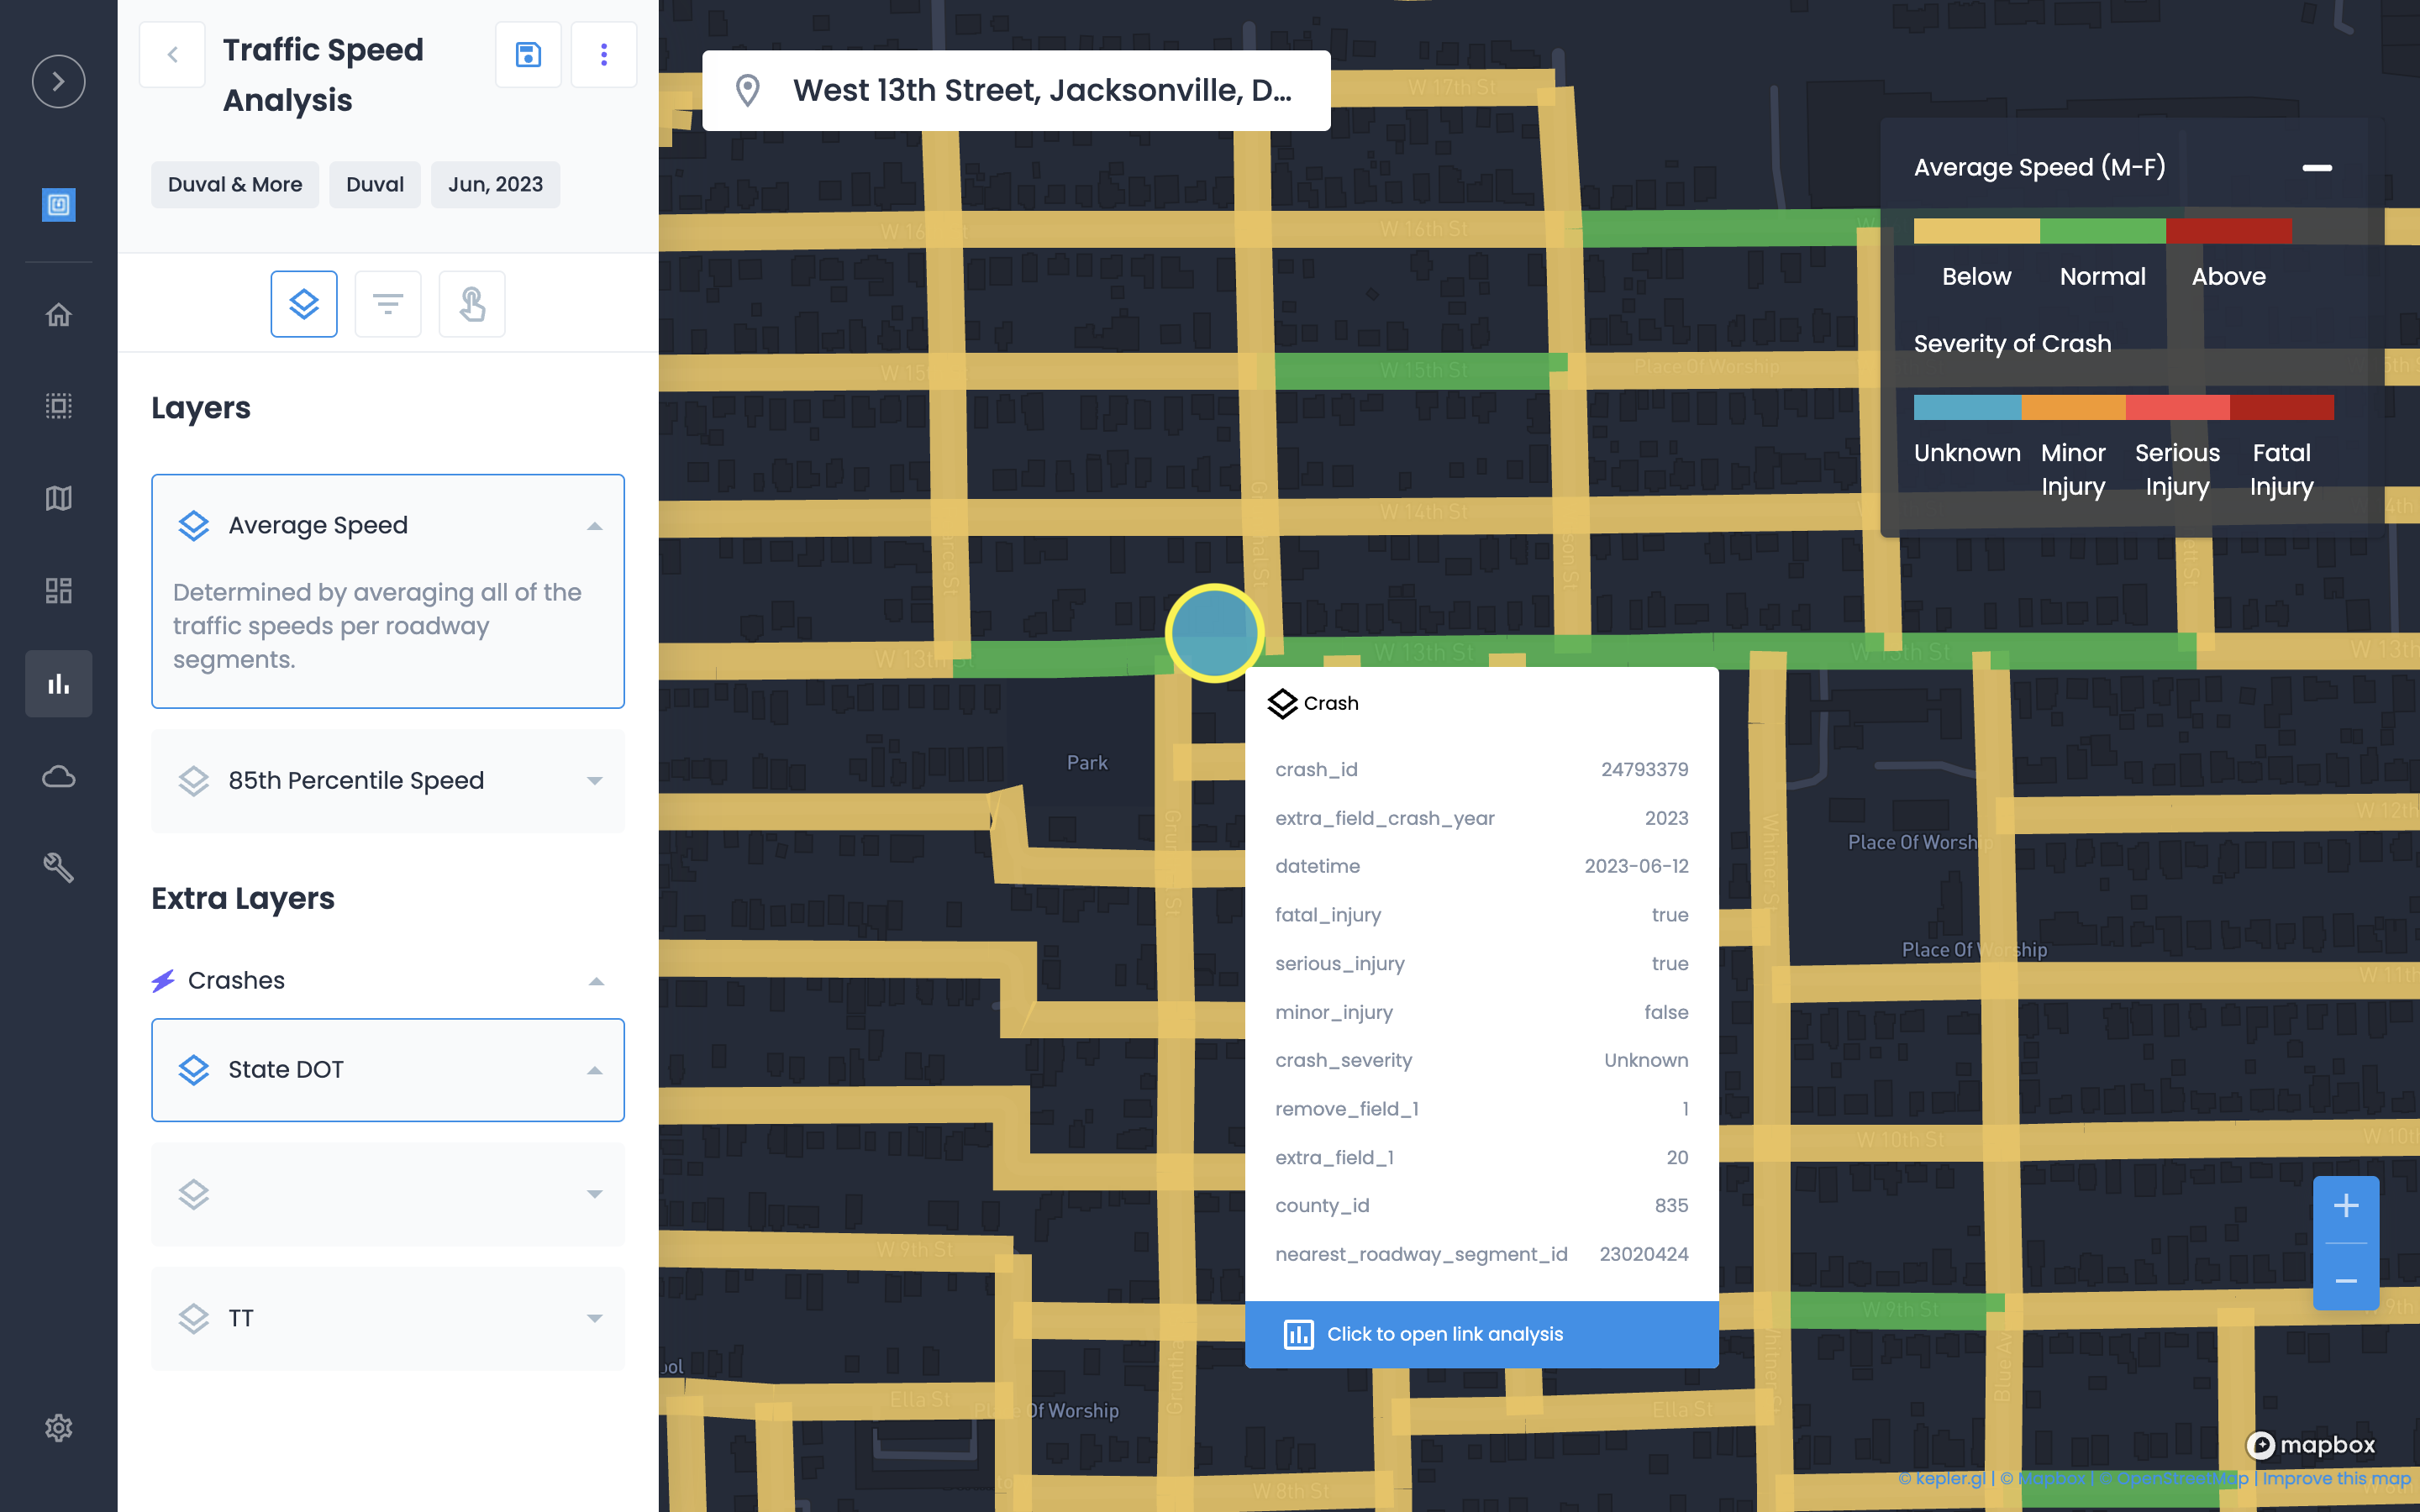
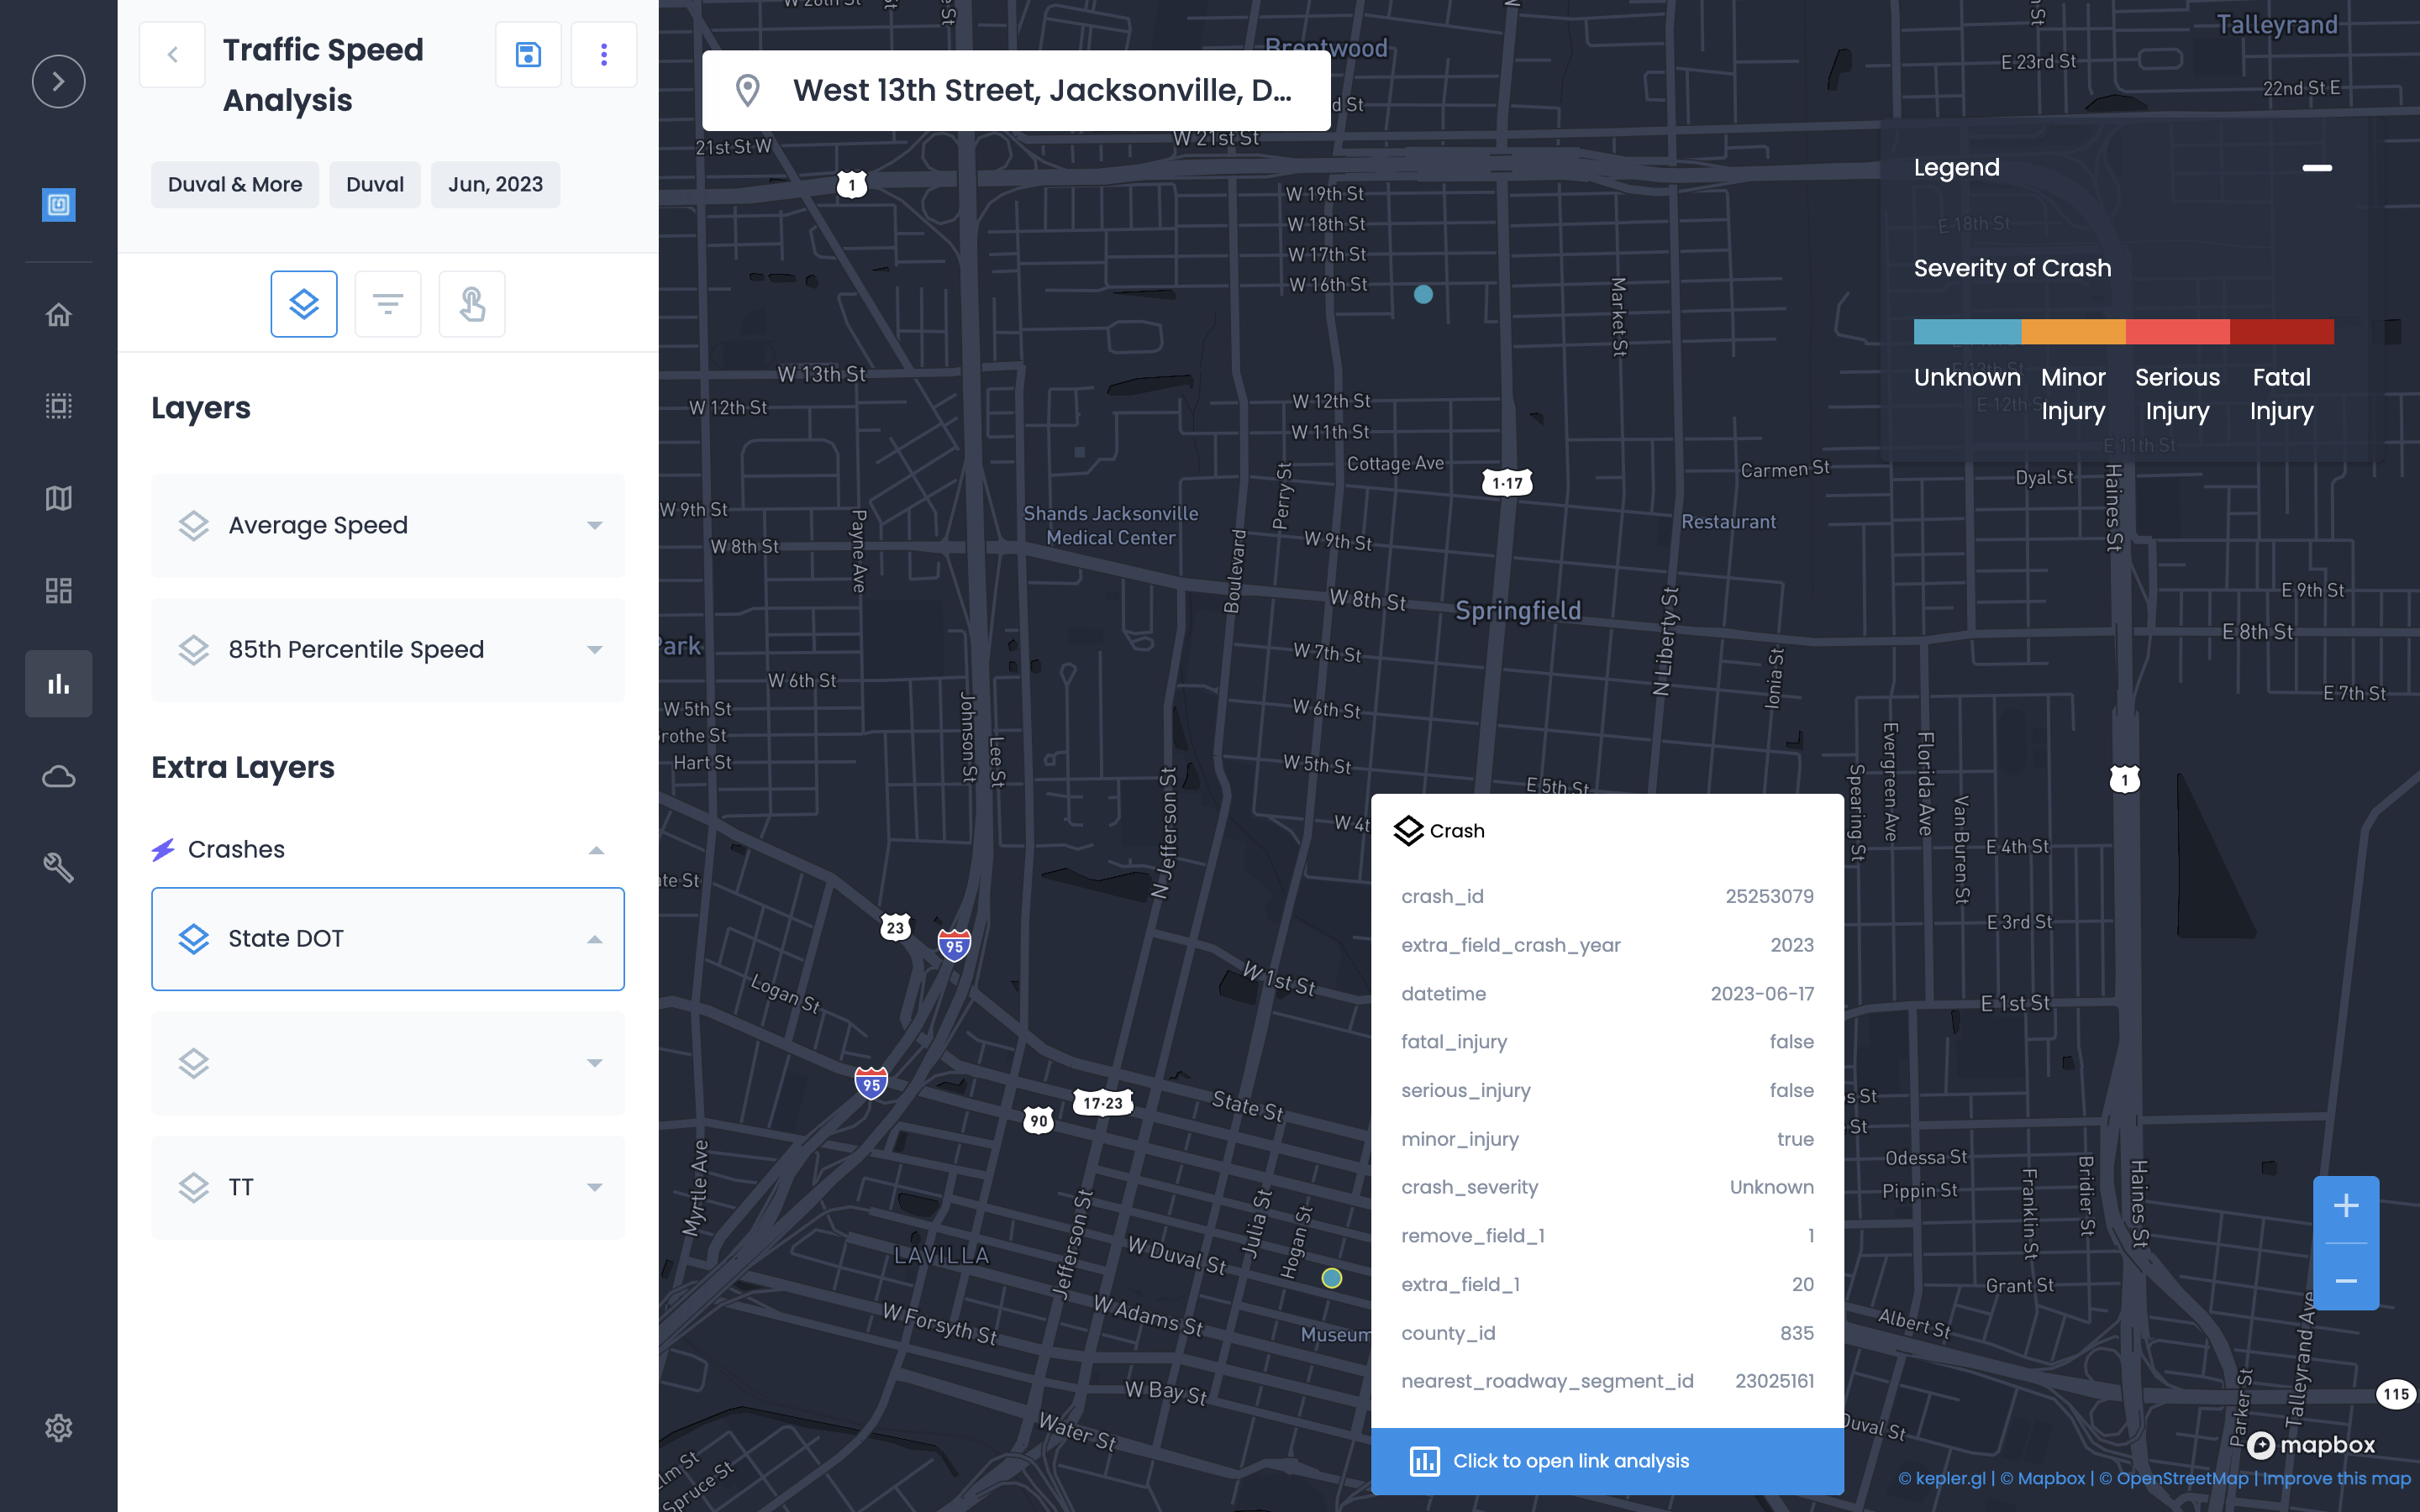
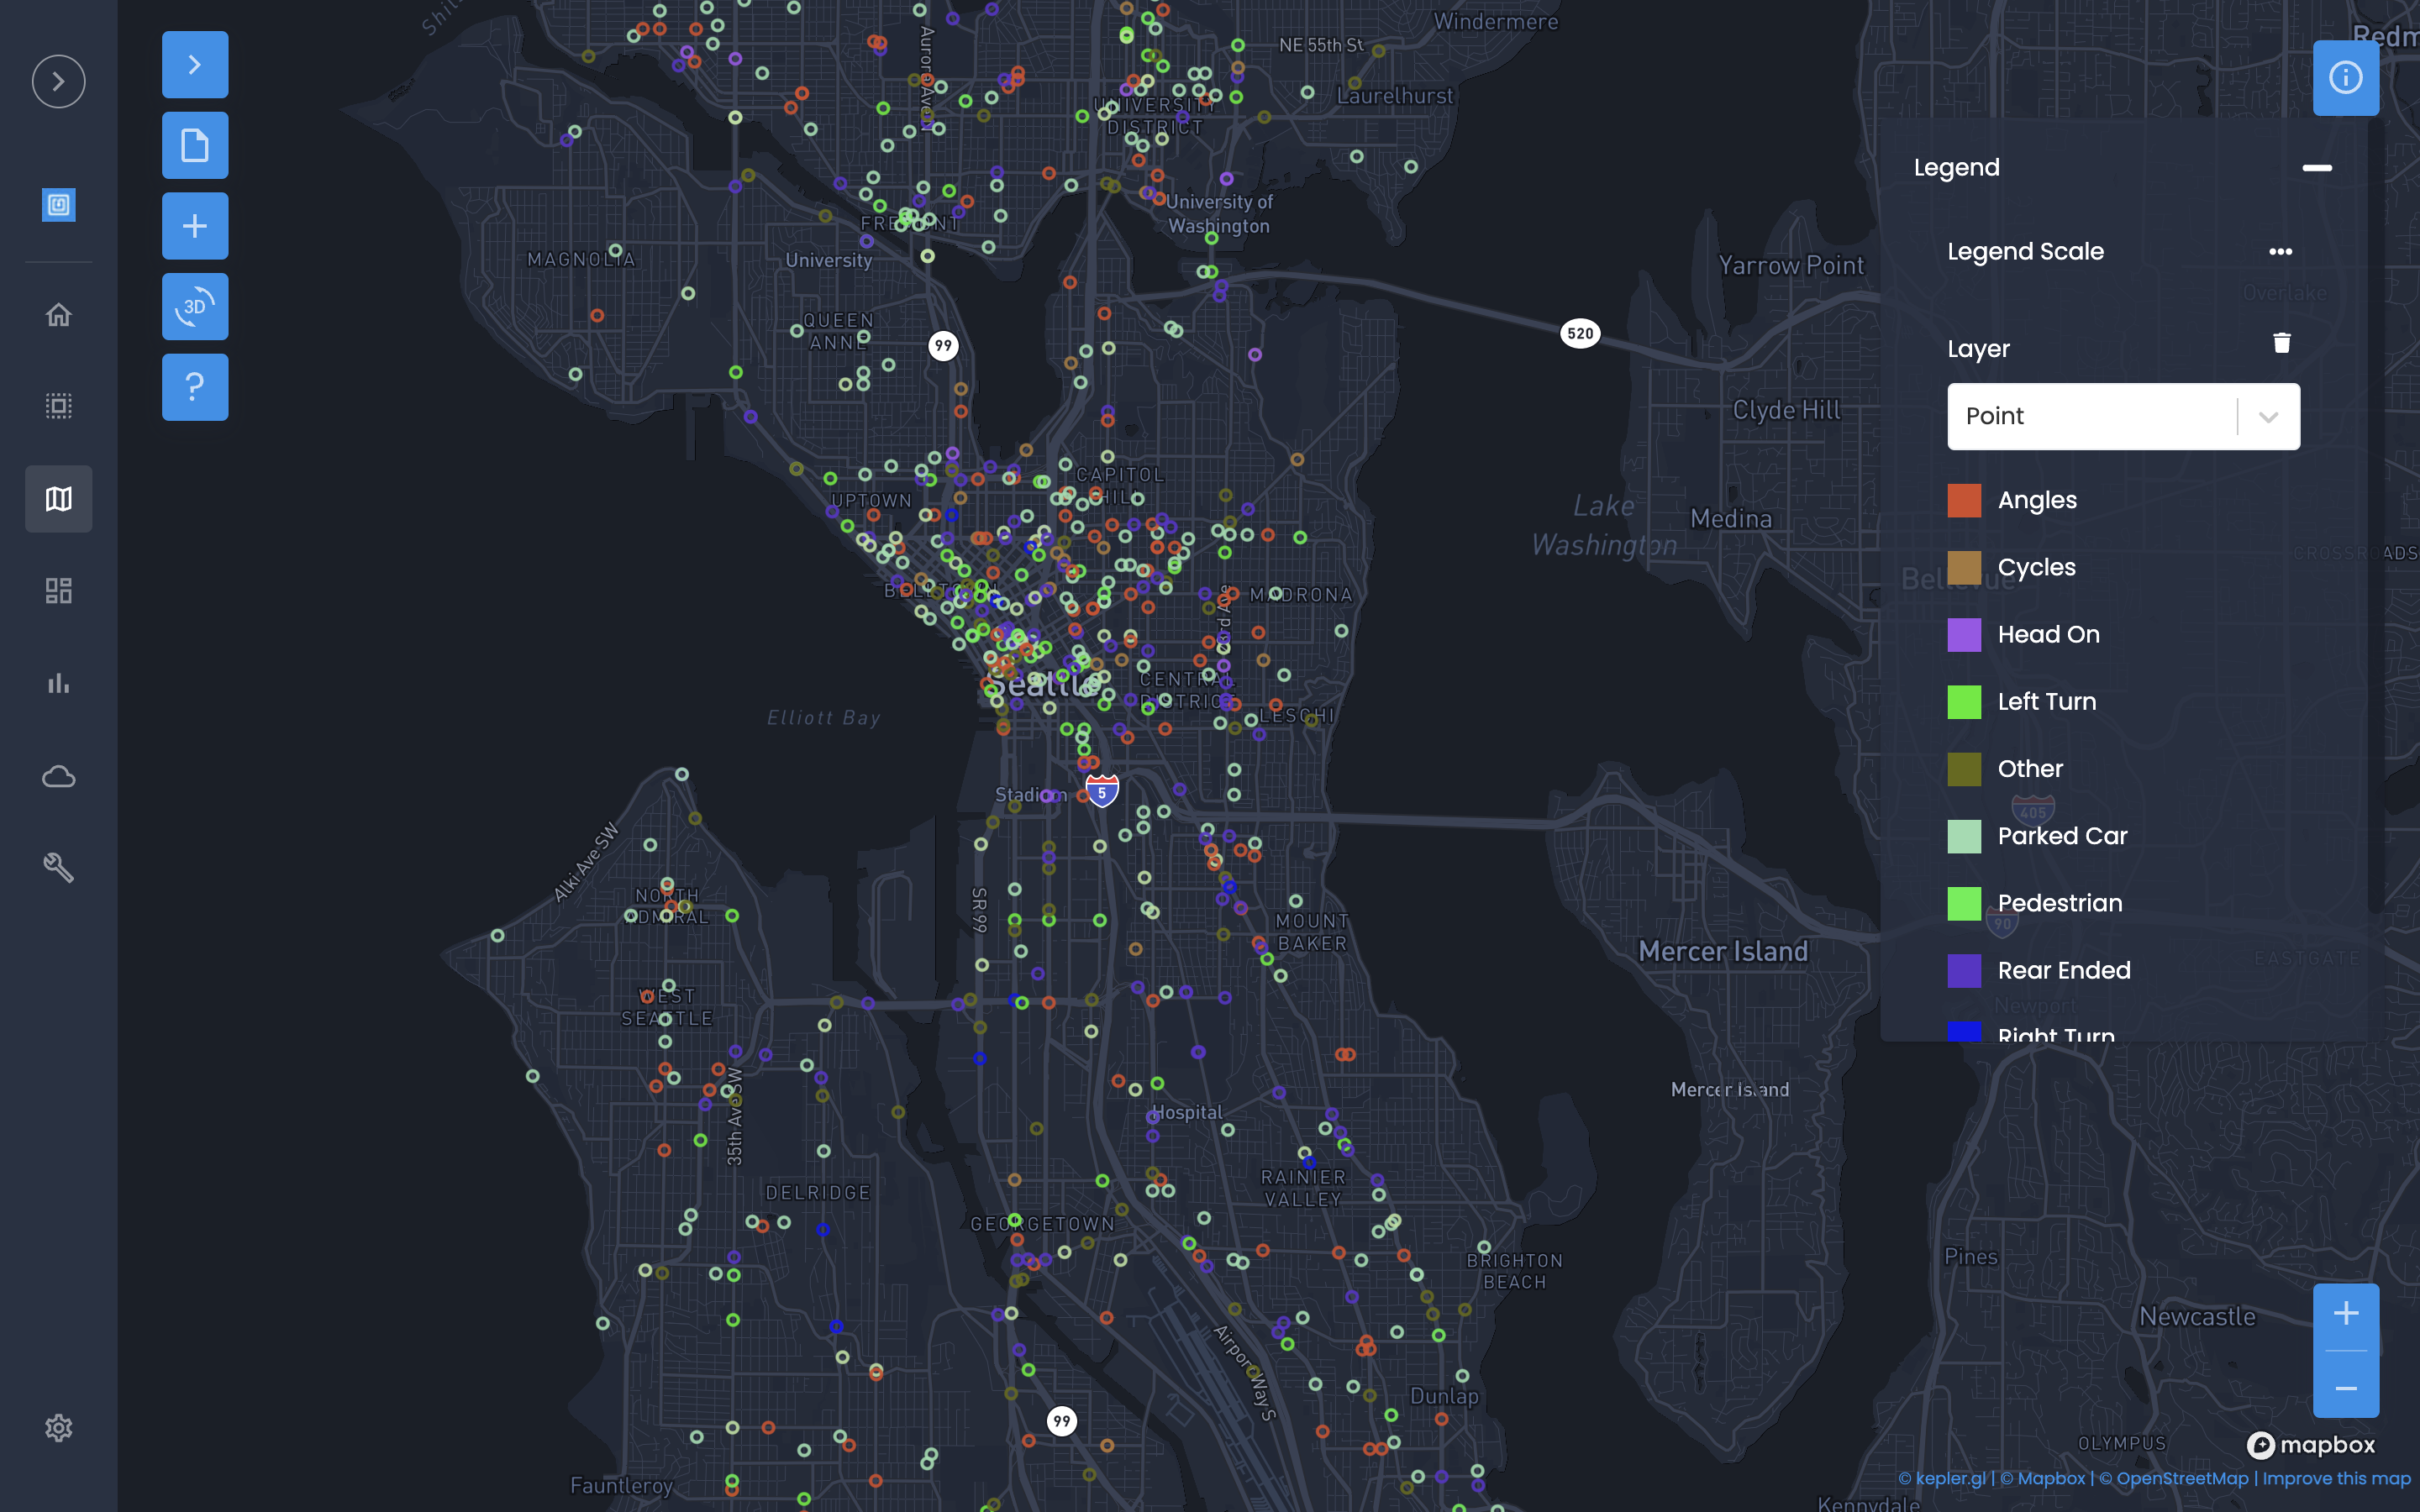
Crash layer allows your team to see crash locations and information in the Insights reporting maps and tooltips. Crashes will display with traffic speeds with based on the month of the incident.
Why's it helpful?
The crash layer helps you see crashes by time and location.
-
You can turn layers on and off at any time.
-
You can have multiple layers for different data sources, crash or incident types.
You can turn layers on and off at any time.
You can have multiple layers for different data sources, crash or incident types.
1. Create Monthly Crash Maps
-
With the crash layer, you can toggle off traffic speeds to display a map of only crashes for that period.
2. Evaluate Traffic Speeds and Historical Crash Locations
-
You can see crash location and the reported traffic speed for the nearest link on the same map.
3. Organize Crash files in one-place
-
Crashes are imported through our Crash Integration.
-
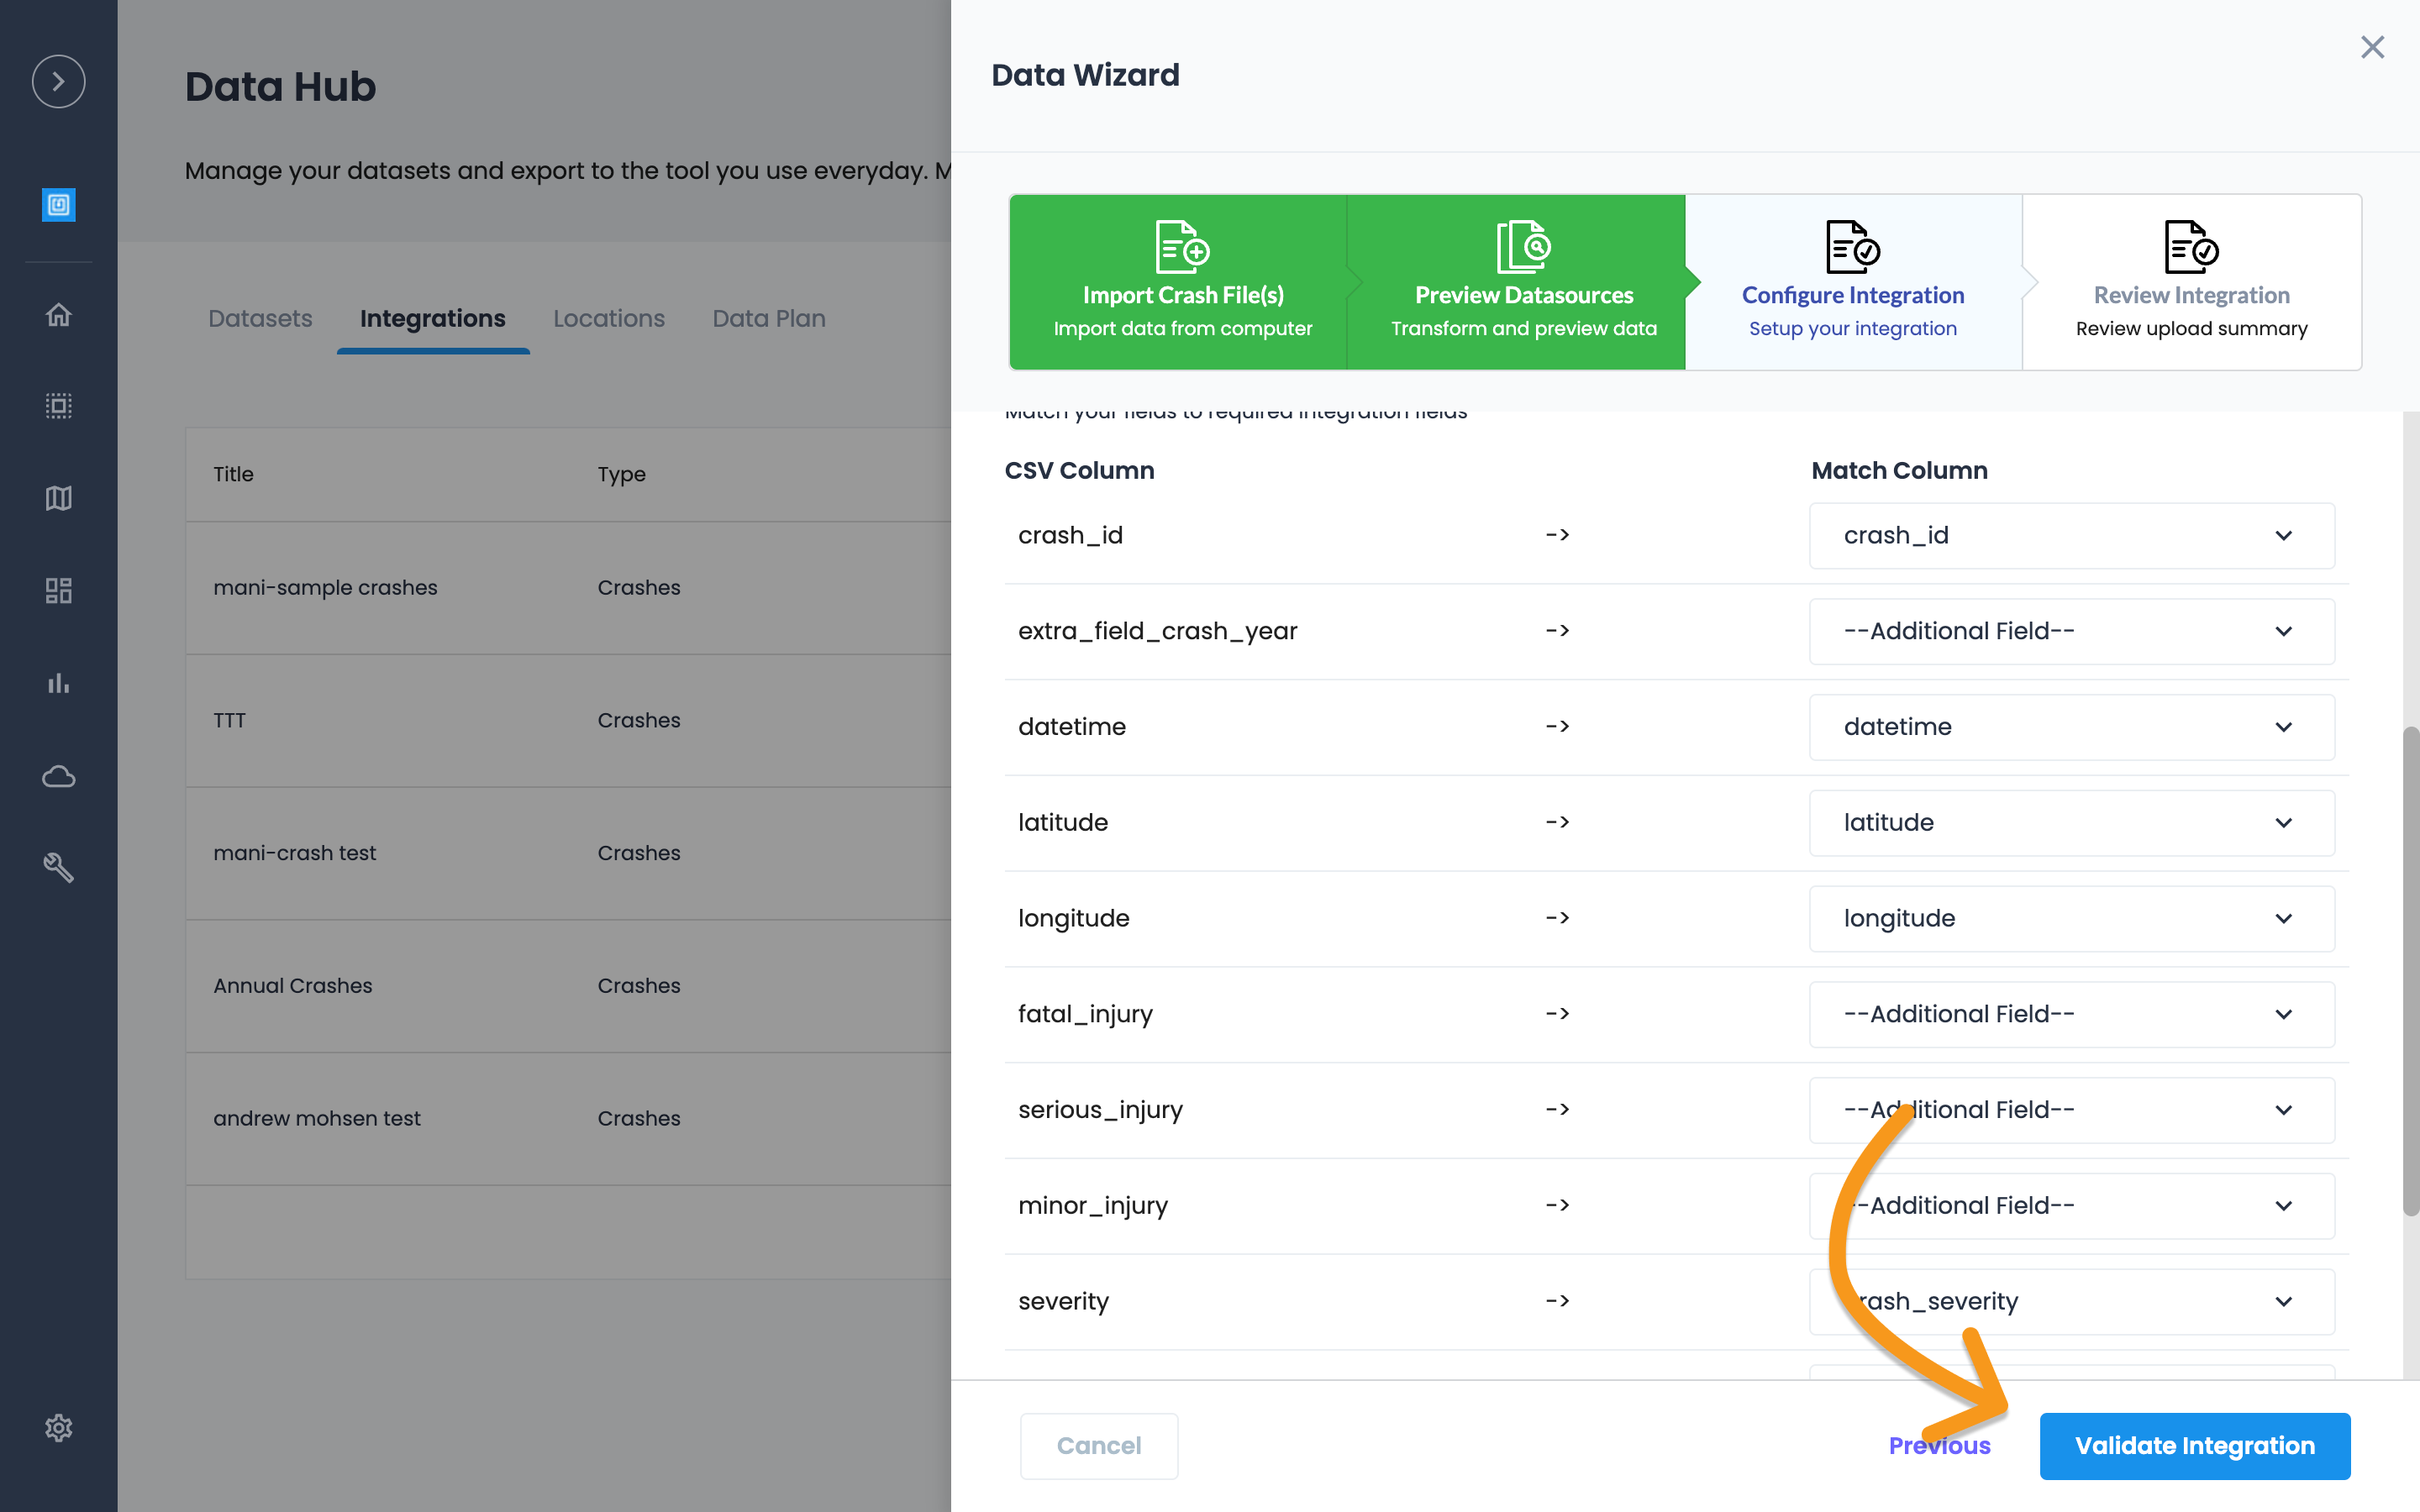
Location (latitude, longitude) are validated and you can match headers for severity and date/time.
-
Once the import is completed, your entire team can see Crashes in Insights, design custom maps in Studio, and download from your Data Hub.
4. Create custom maps with Crashes in Studio
-
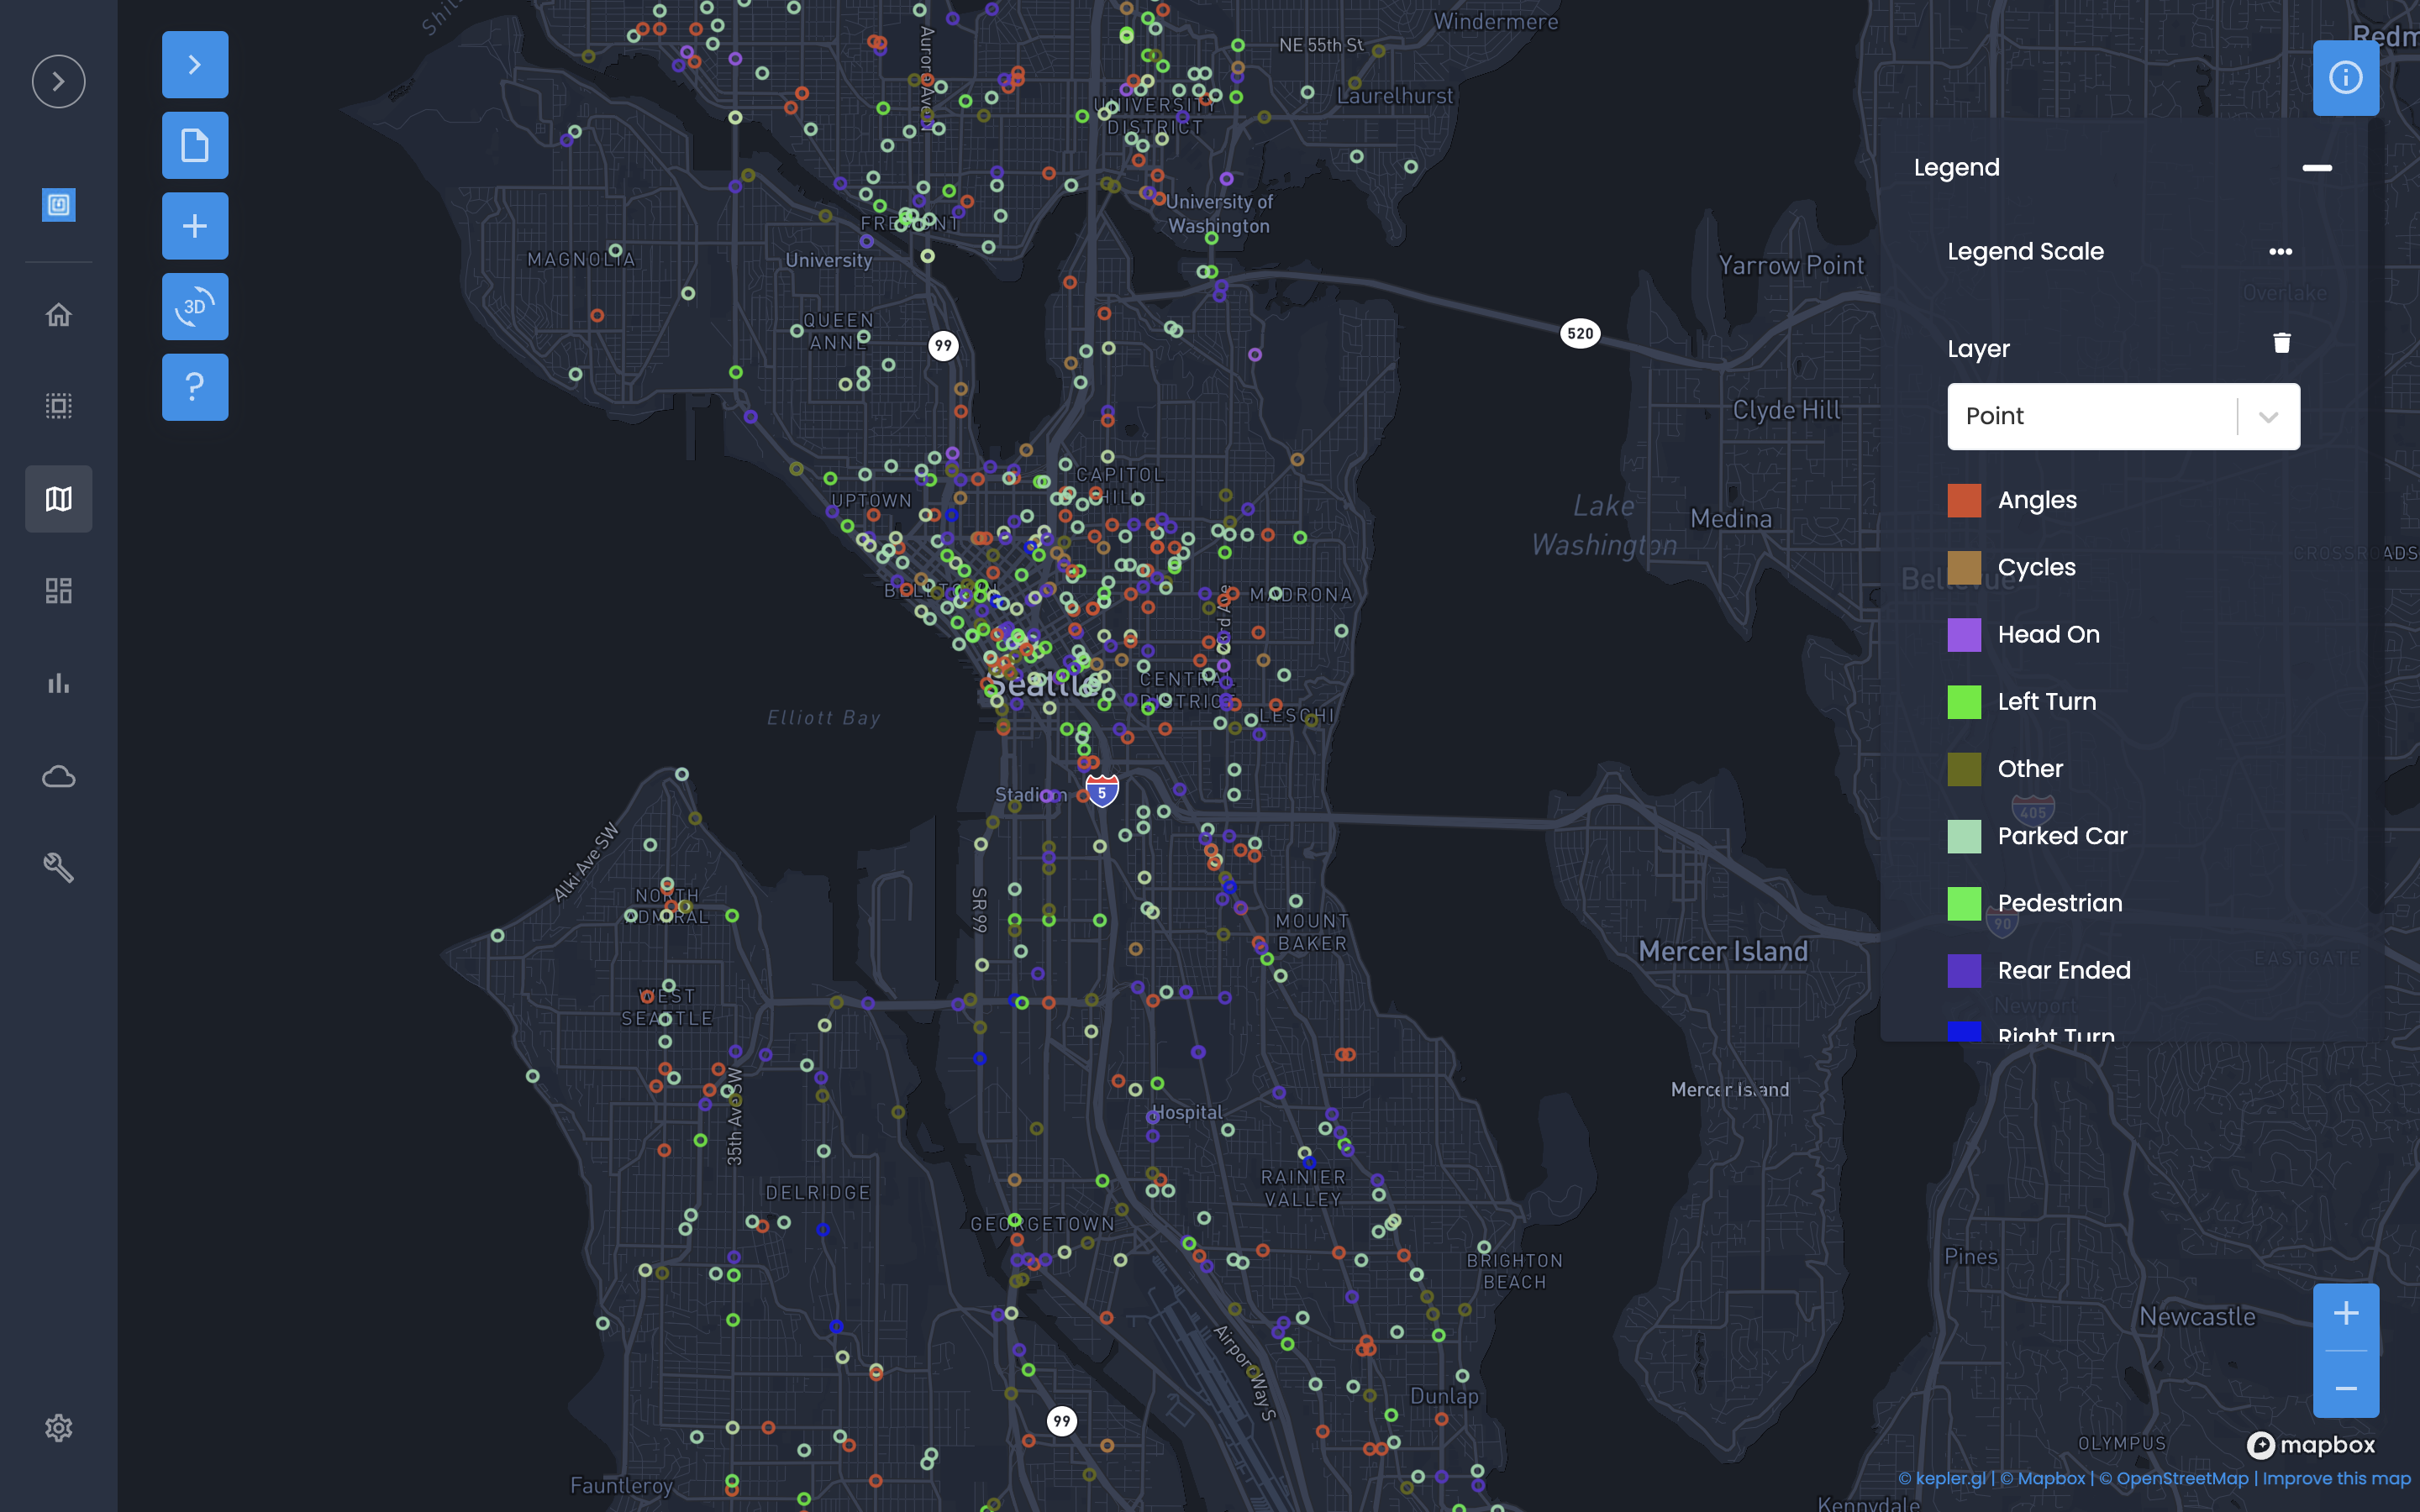
Once crash locations are validated, the file is available to be imported to any Studio map. You can create custom maps for safety planning, traffic calming analysis or incident reporting on the fly.
Once crash locations are validated, the file is available to be imported to any Studio map. You can create custom maps for safety planning, traffic calming analysis or incident reporting on the fly.
Crash layer requires you to create a Crash Integration in Data Hub. The integration is just a simple file upload and matching of column names to required fields. Urban SDK does not provide crash files or validate crashes imported by any user. Please contact support for additional assistance and best practices - help@urbansdk.com.
Watch a 1 minute Training Video
TL;DR: 7 Steps to add Crash Layer to Insights
-
Sign in to your Urban SDK account
-
Select Integrations from the Data Hub dropdown
-
Select "Create Integration"
-
Select "Crash Integration"
-
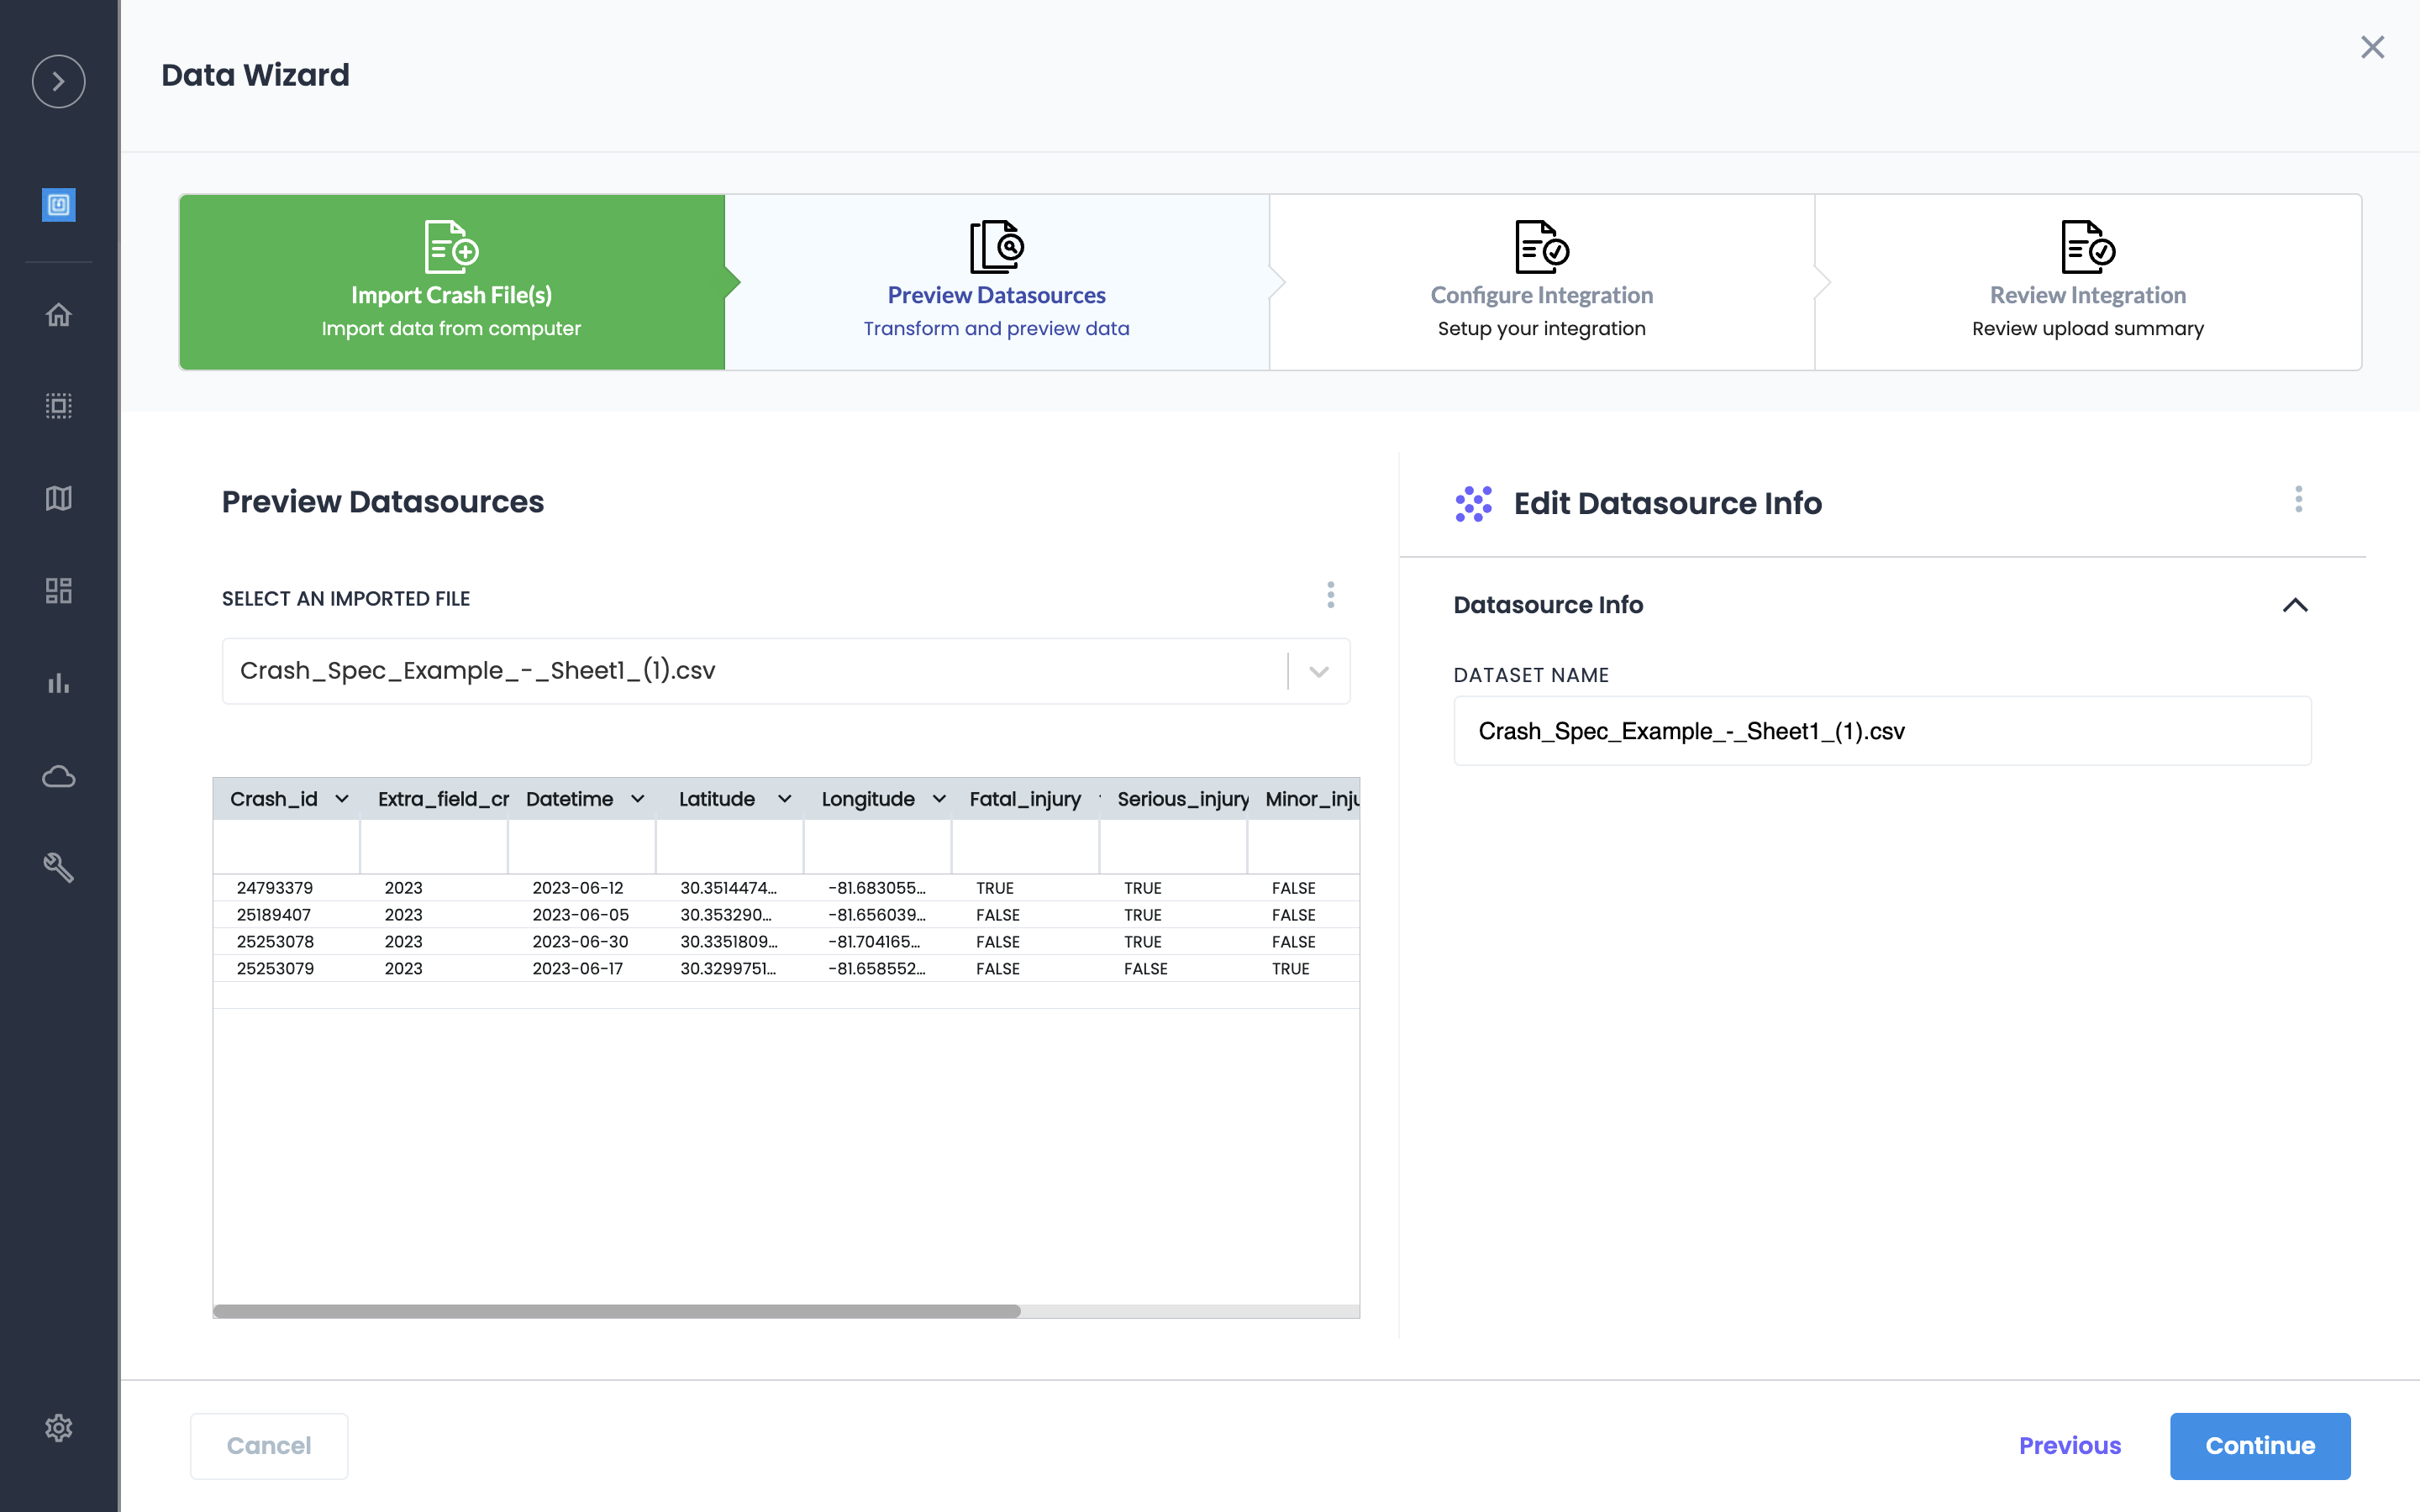
Upload and name your file
-
Match required fields (Crash ID, date-time, lat/long, severity)
-
Select "Create Crash Integration"
-
Done
Once complete, Crash Layer displays in Insights, is available for customization in Studio, and download from Data Hub.
Sign in to your Urban SDK account
To access Insights, you must login and click to your organizational account.
-
Select your Organization from the dropdown
.png)
Select Data Hub > Integrations
Once on your home screen then select Data Hub from the left hand menu navigation, open drop down to select "Integrations"
-
Select Integrations from the left hand navigation (https://portal.urbansdk.com/datahub/integrations)
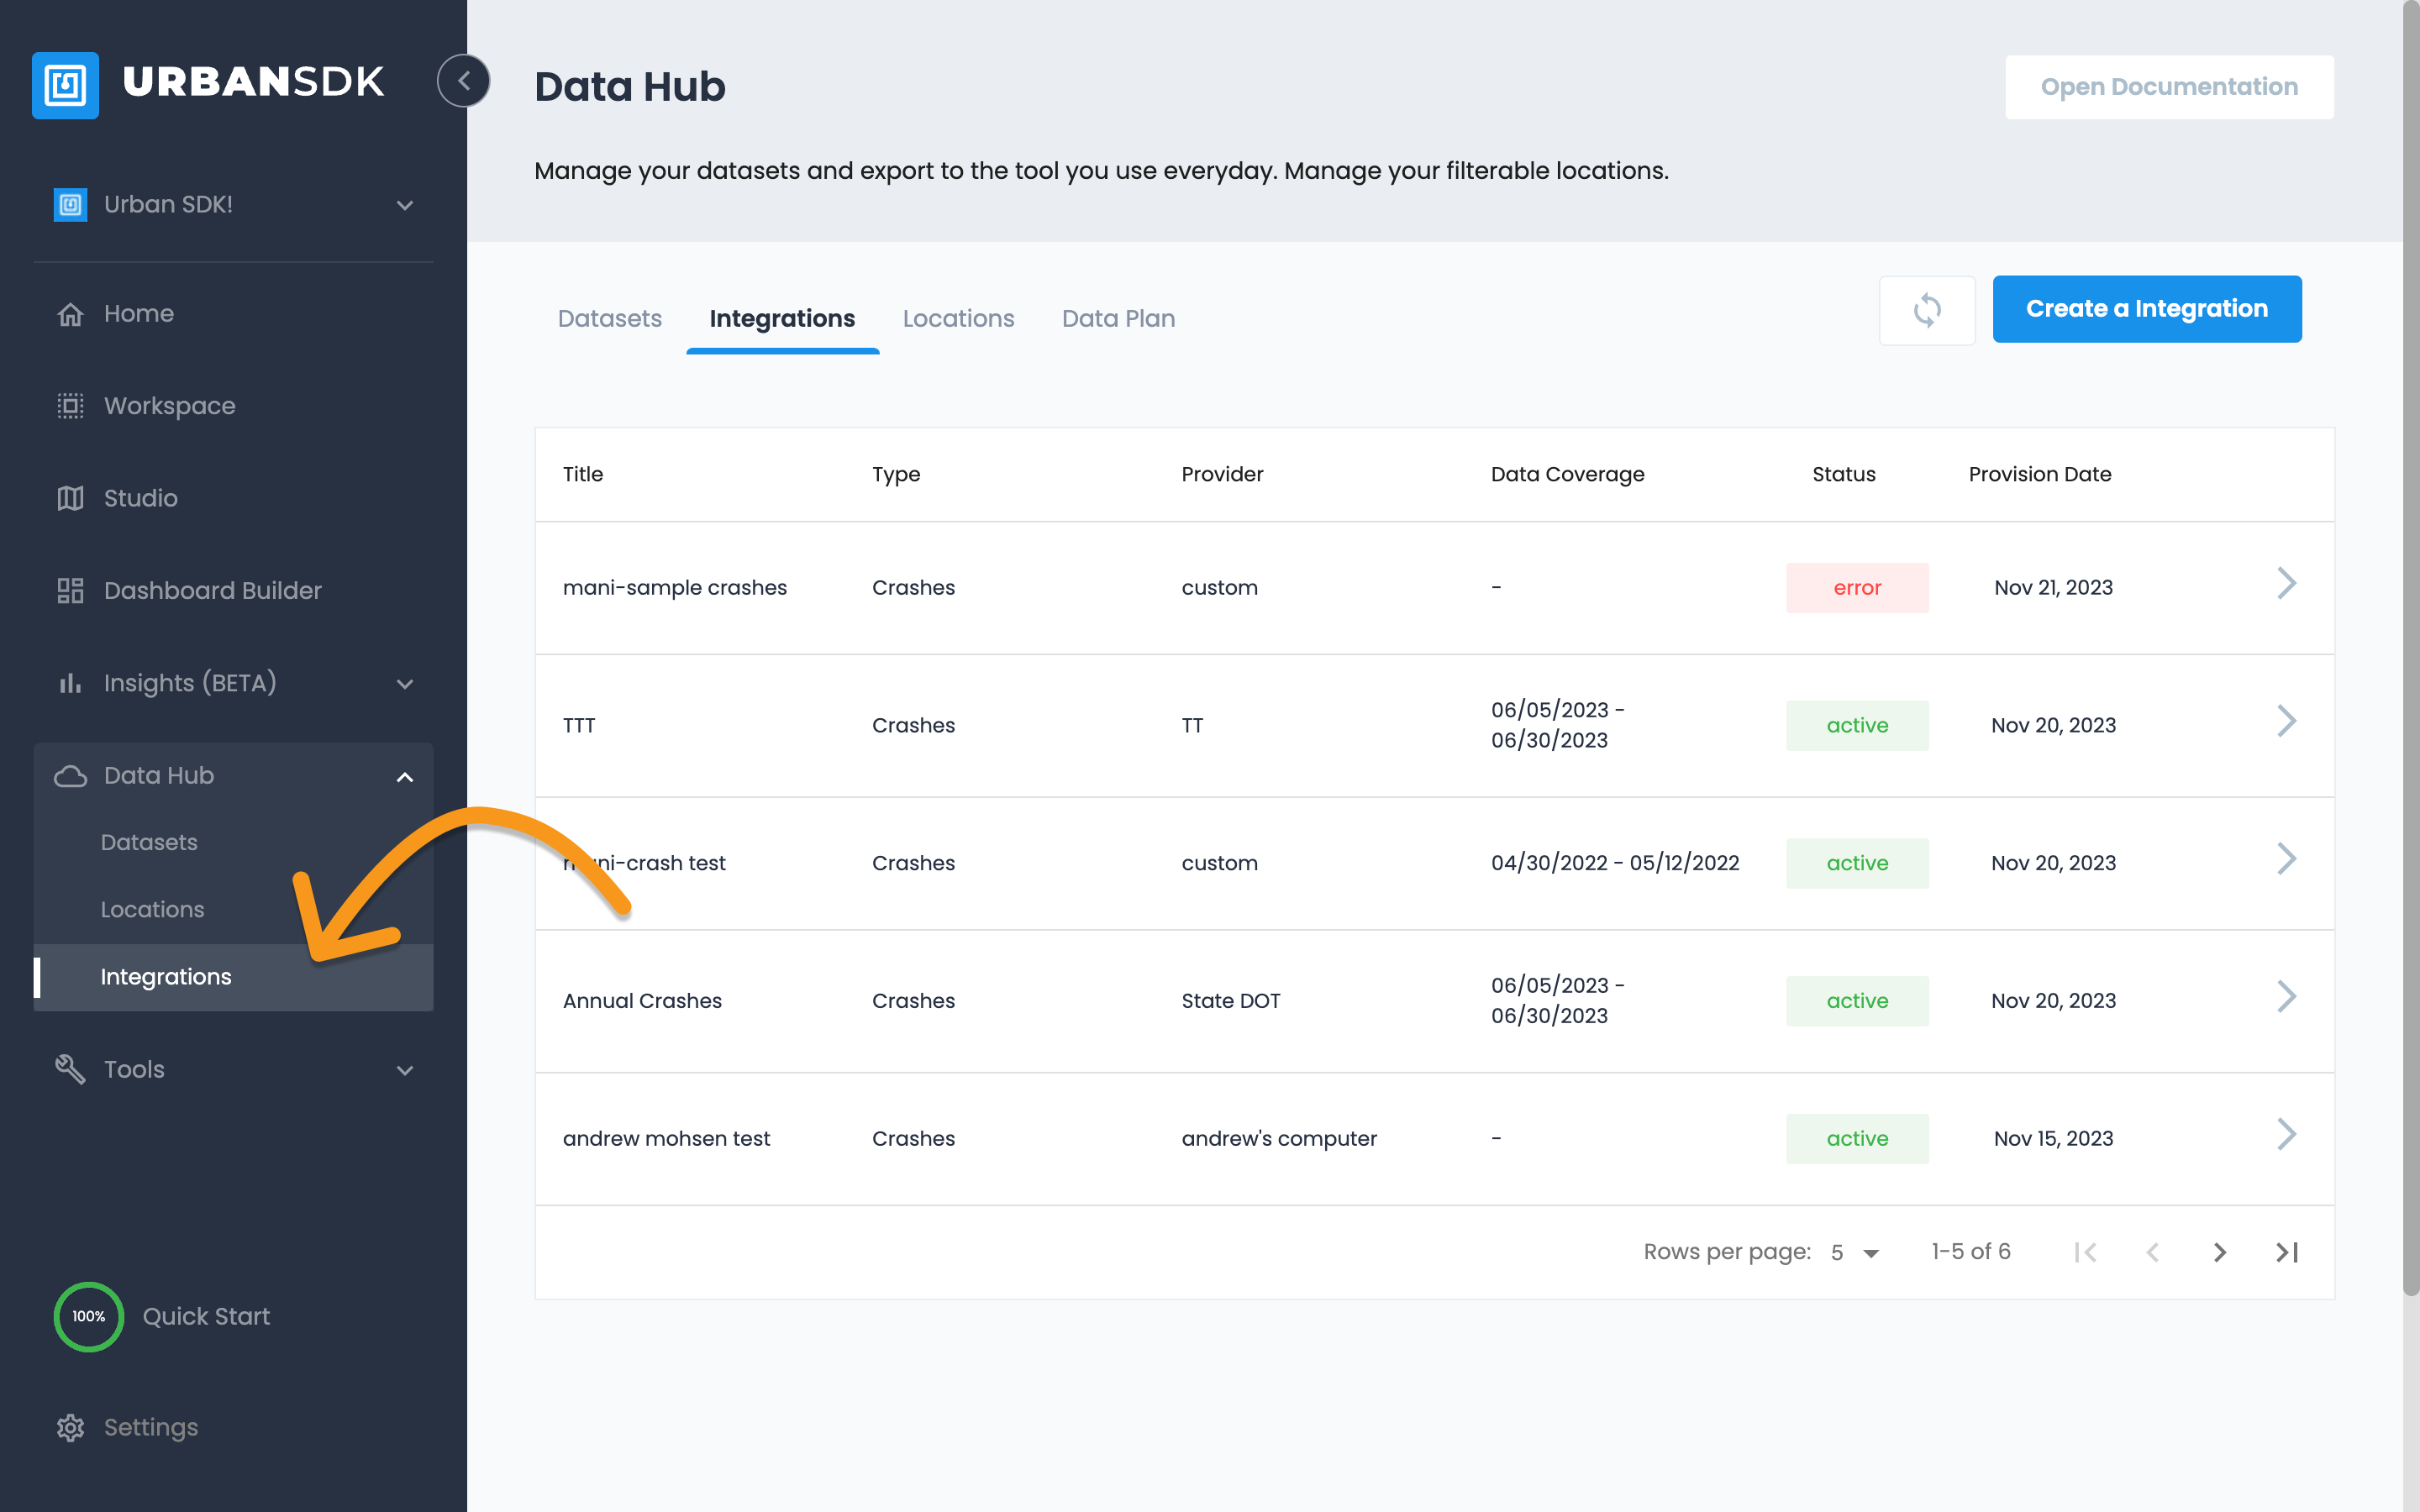
Select Create a Integration
-
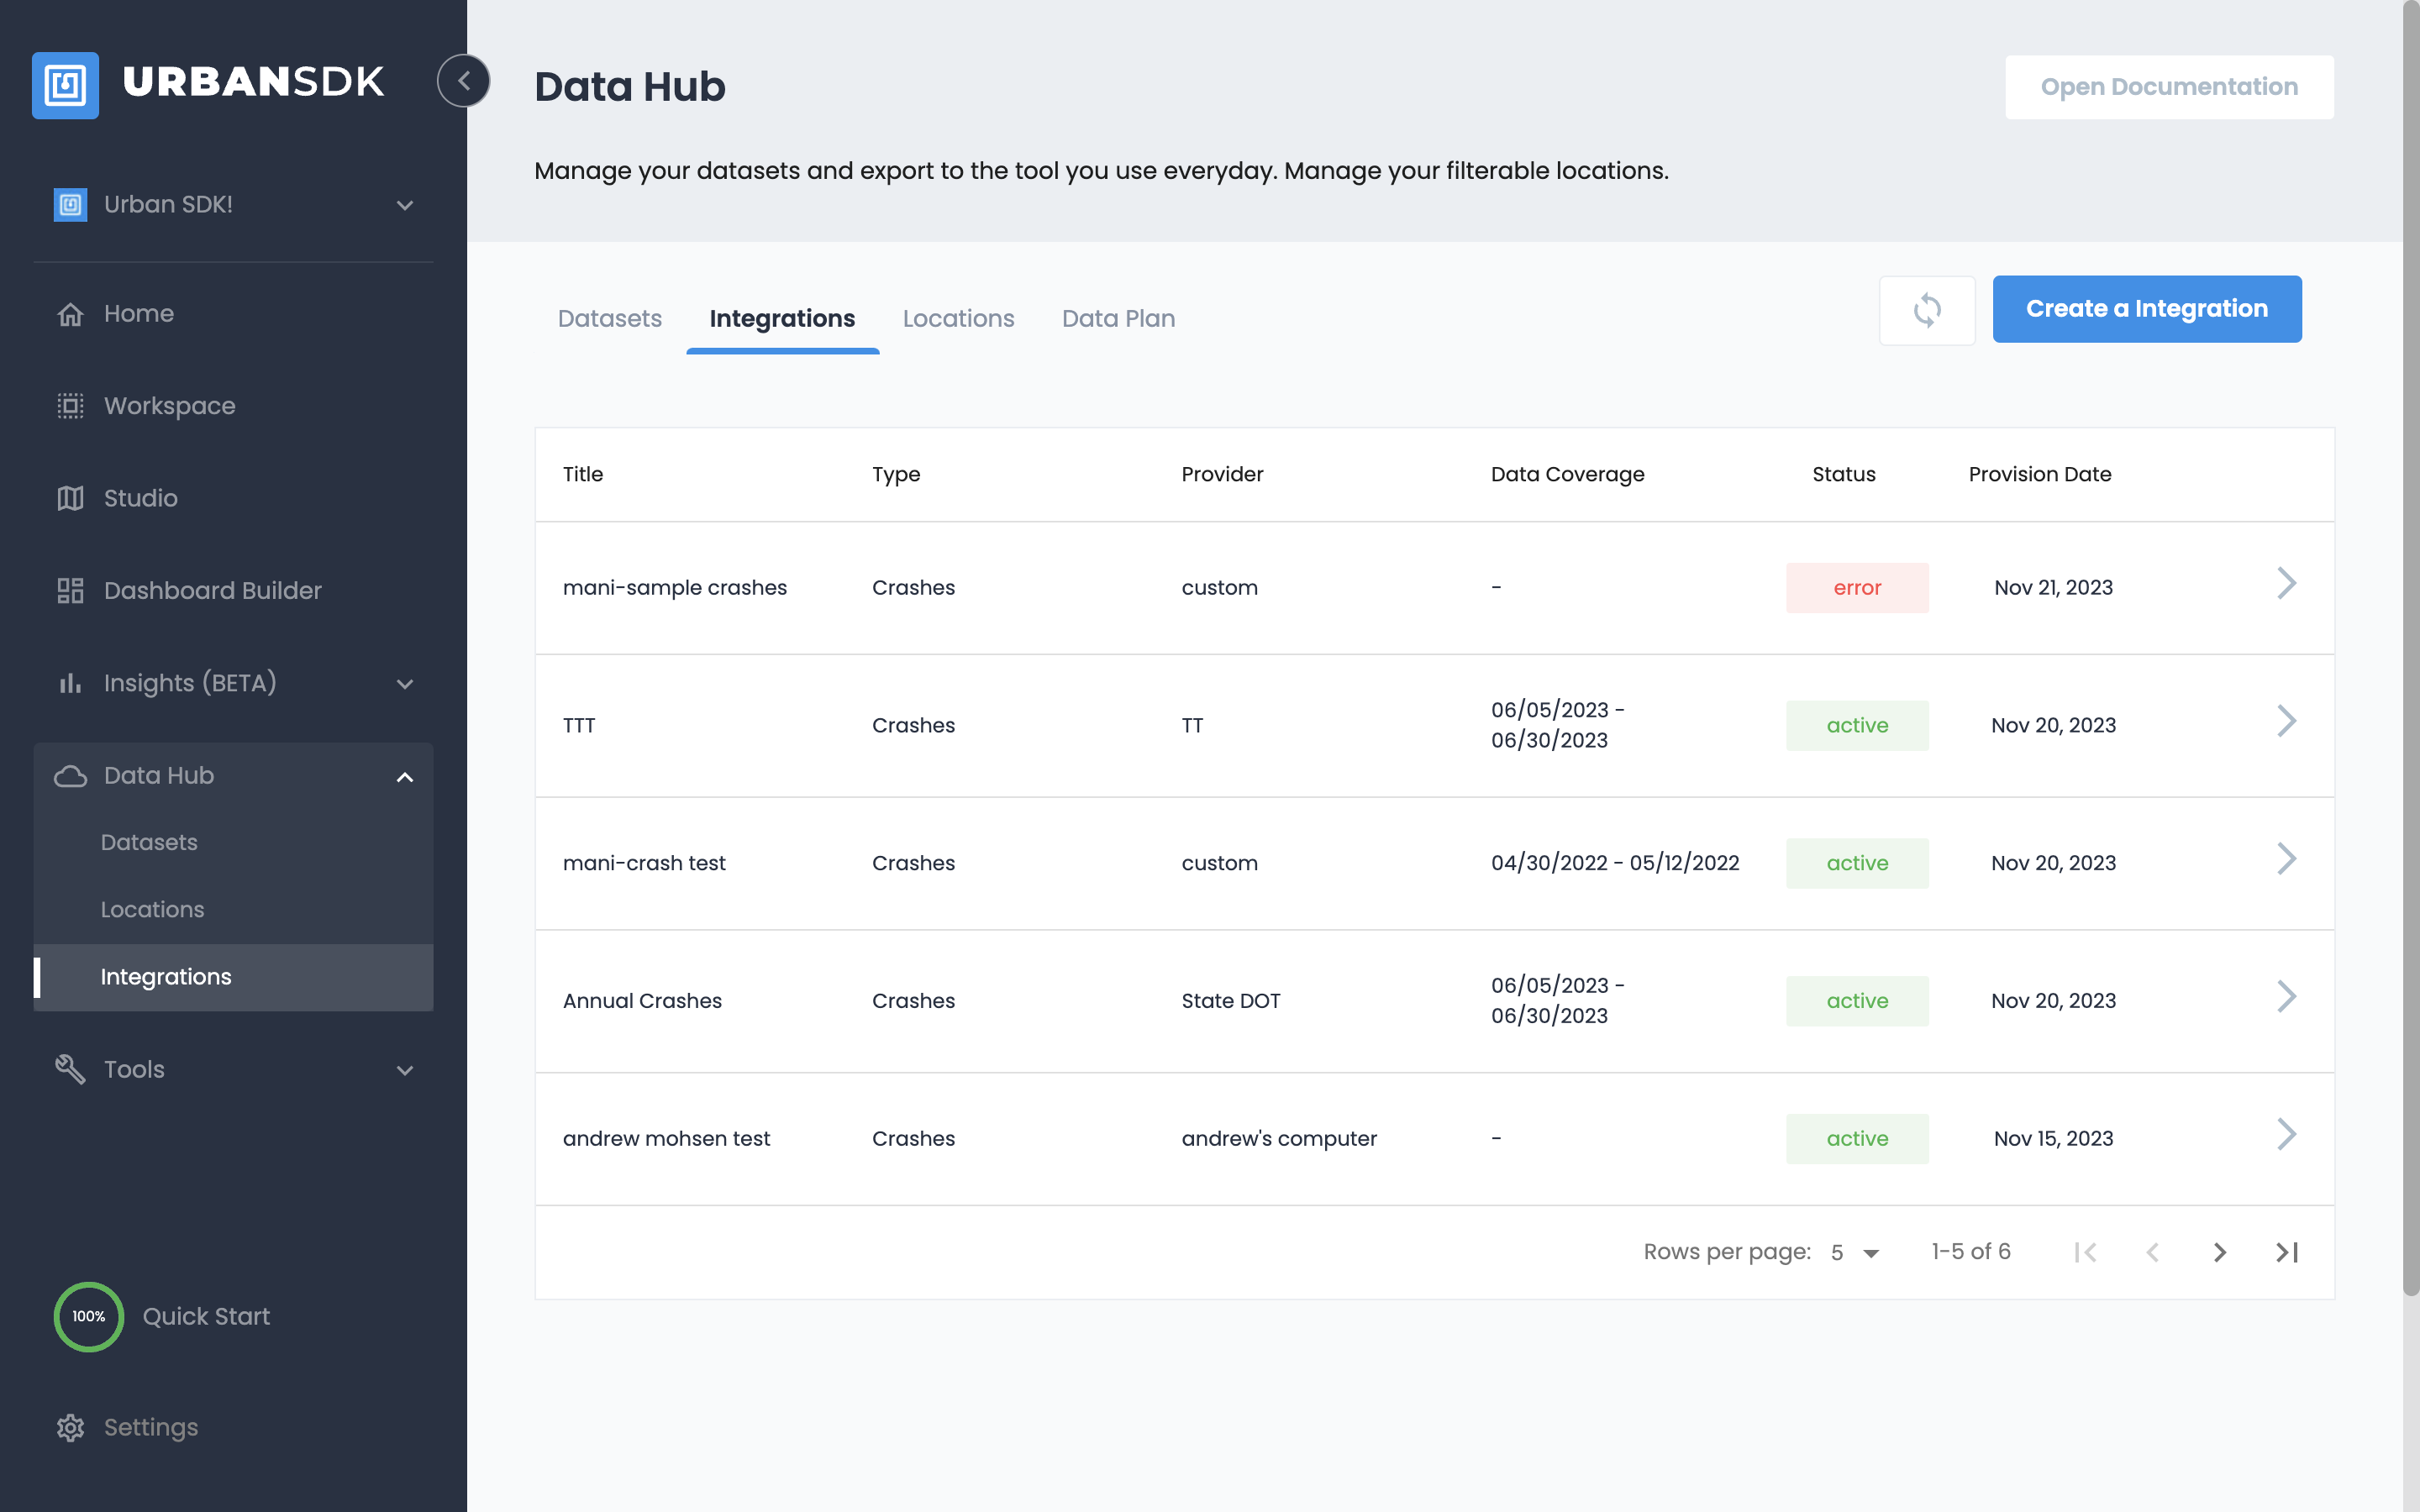
Select Create an Integration button to add a new integration.
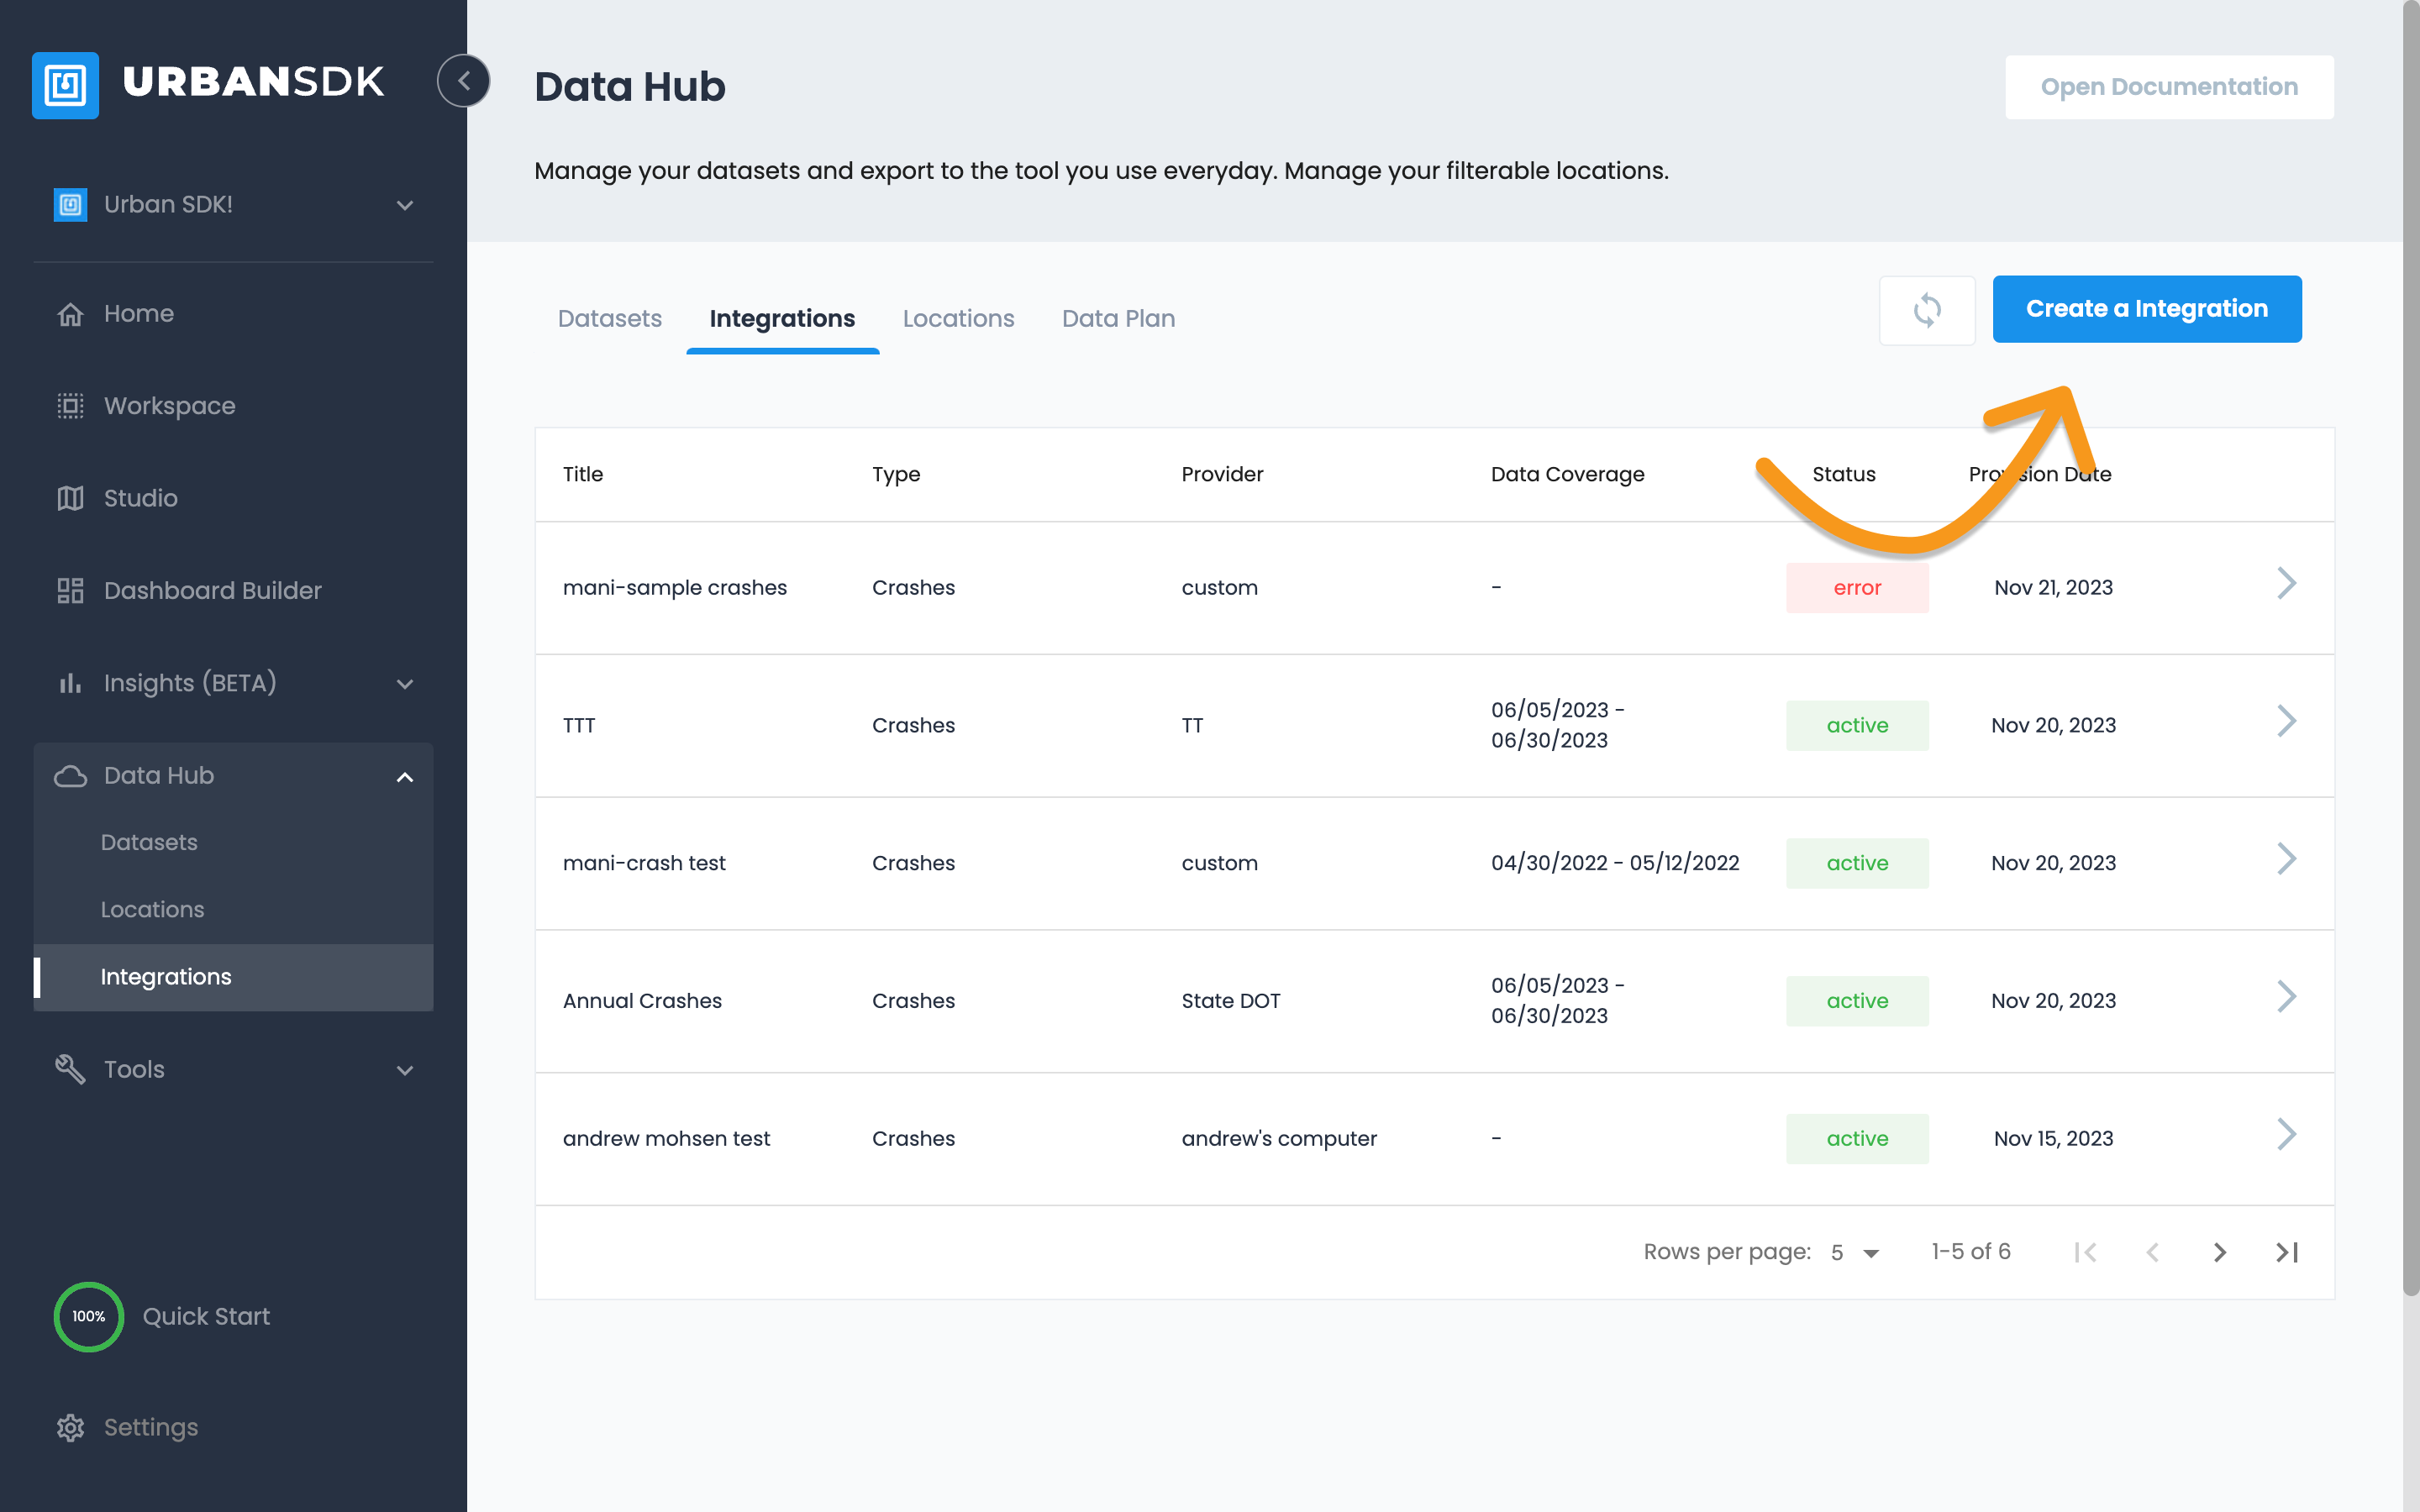
Select Crash Integration
-
Select "Create Crash Integration" and "Continue"
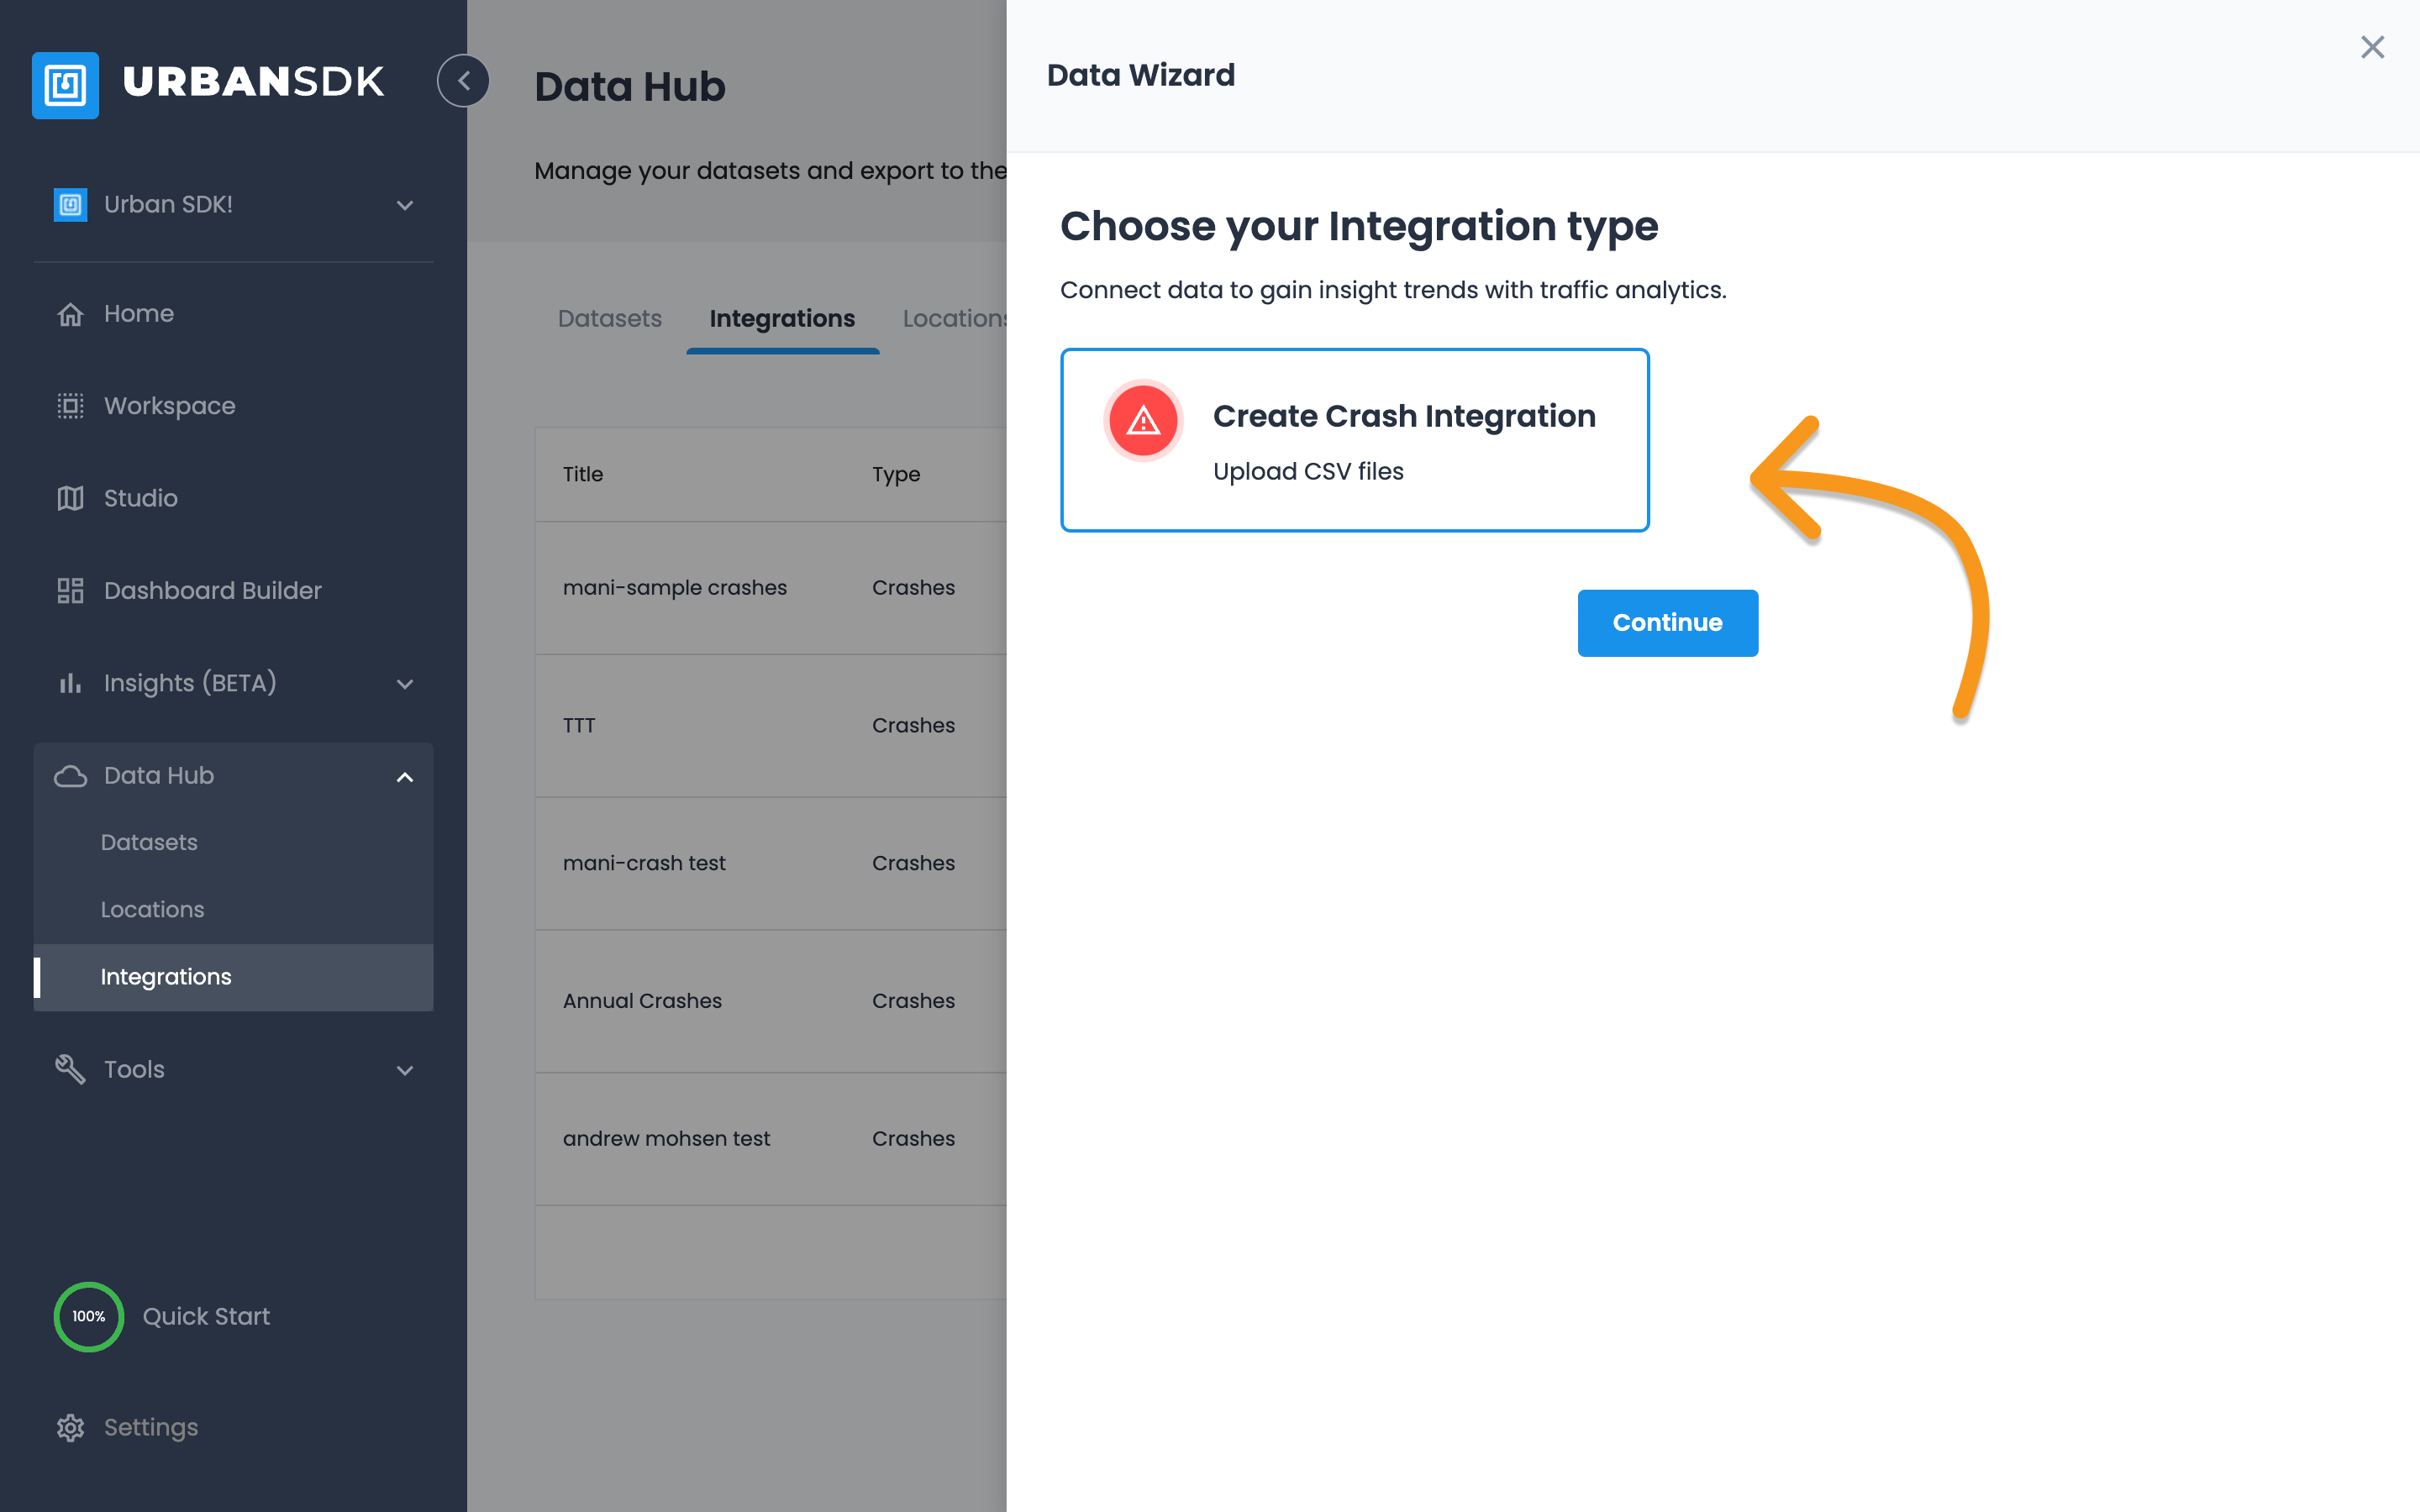
Upload your file and review file
-
Upload a crash file from your desktop
-
Select Continue to review file
-
Select Continue to Match Fields
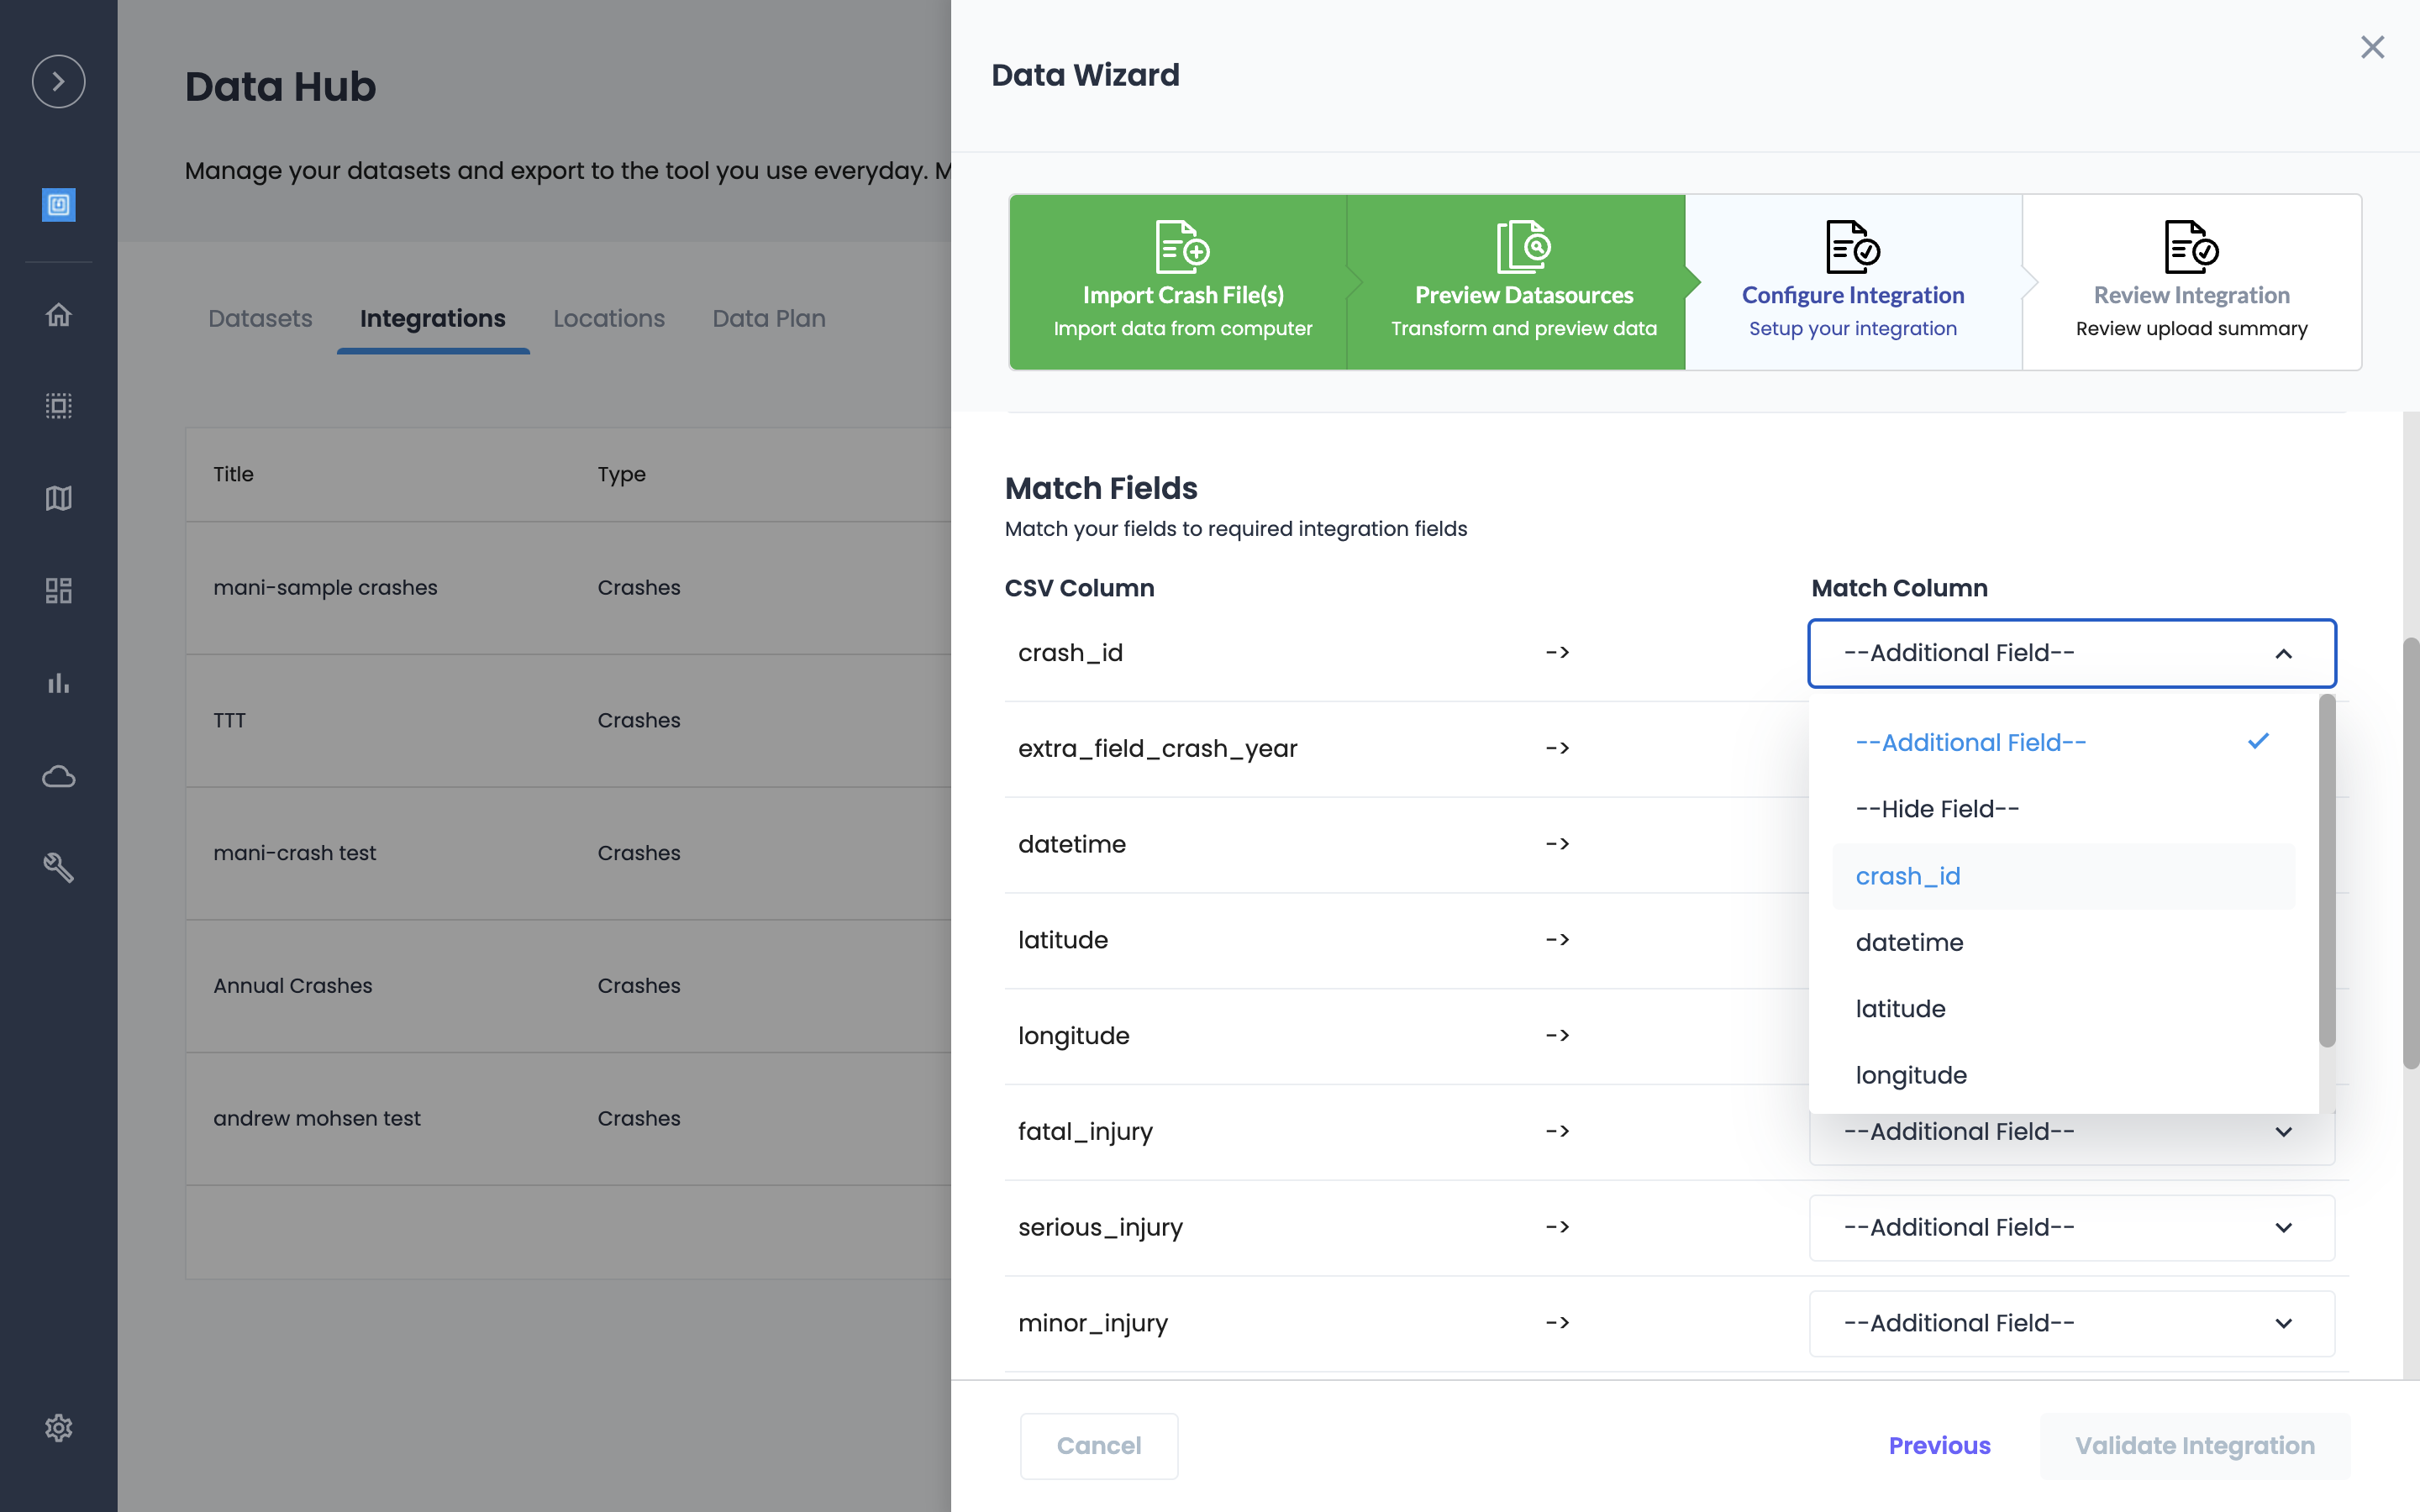
Give your Integration a Name and Match required fields
Integration name will appear in Insights.
-
Add Integration Name (required)
-
Add Datasource (optional)
-
Must match all required fields
-
Crash ID
-
Date Time
-
Latitude
-
Longitude
-
Crash Severity
-
-
All other fields are optional to include.
Validate Integration and Create Crash Integration
-
Once all required fields are selected as a match, select "Validate Integration" to import and submit
-
Confirm file and select "Create Crash Integration"
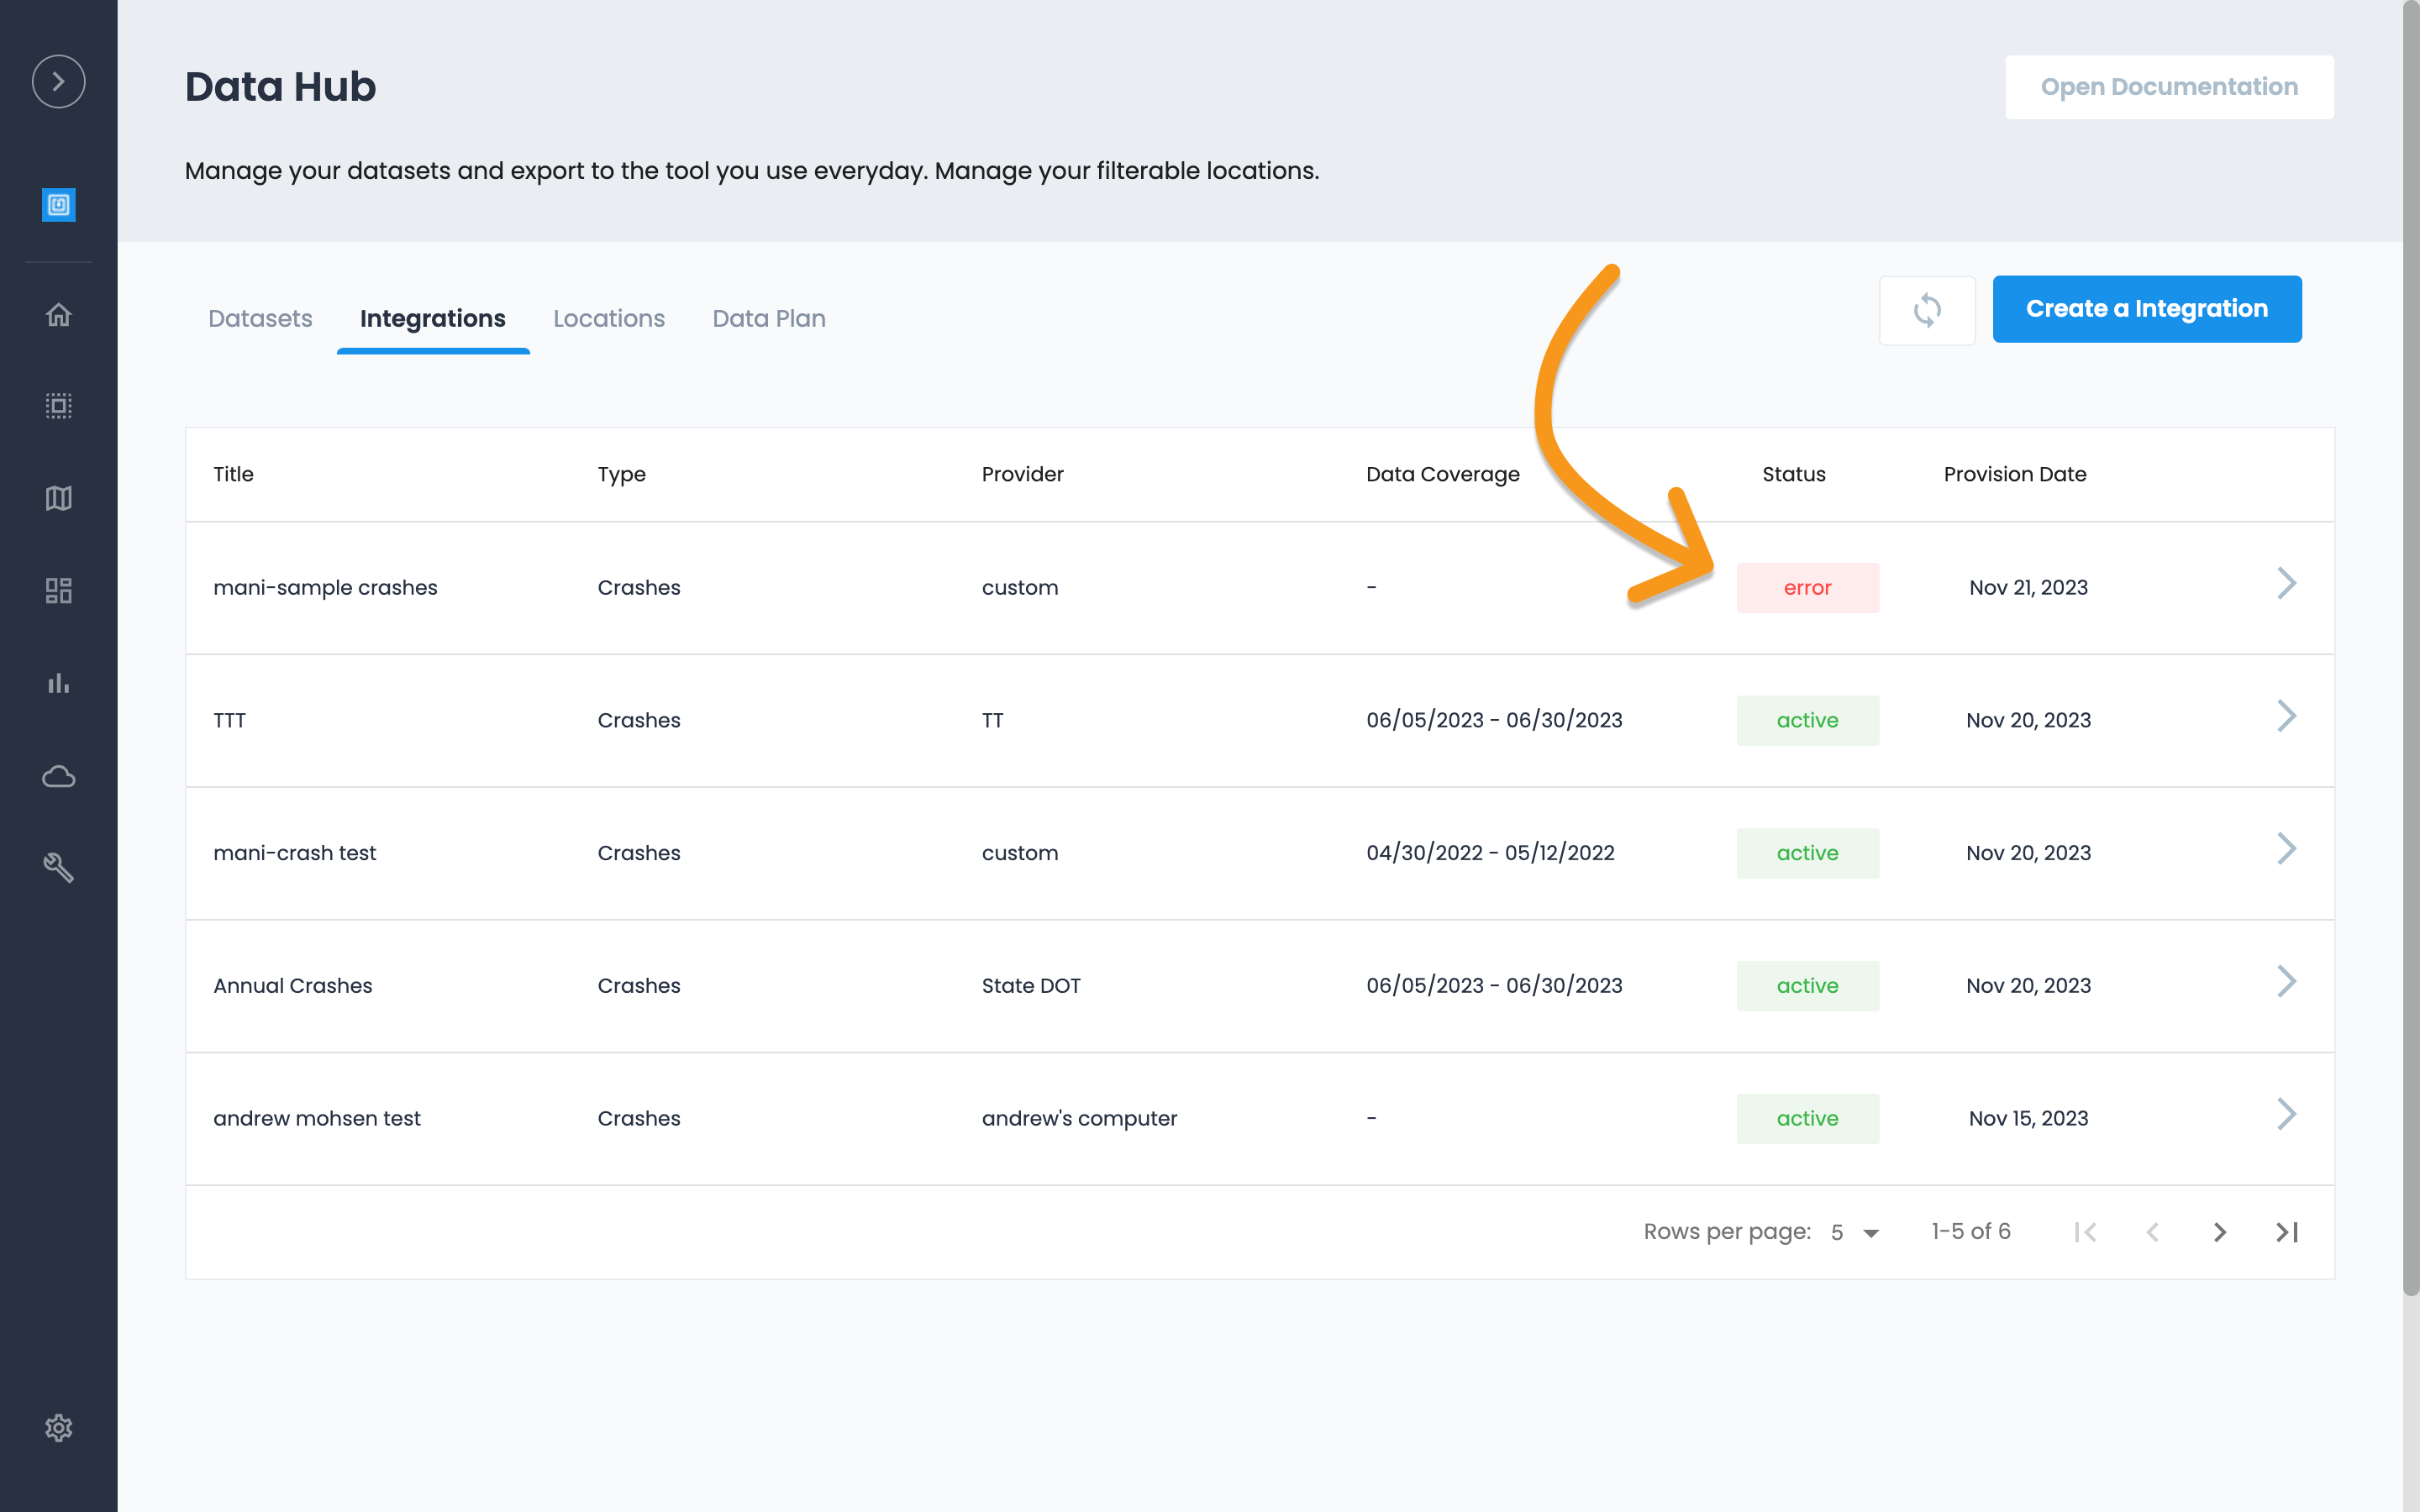
All integrations will require a few moments to process. Once complete the Data Hub Status will show "Active." If an error occurs you will have a Status of "Error" and will require you to re-submit via the steps above. Please contact support for additional assistance and best practices - help@urbansdk.com.
Turn on Crash Layer in Insights
-
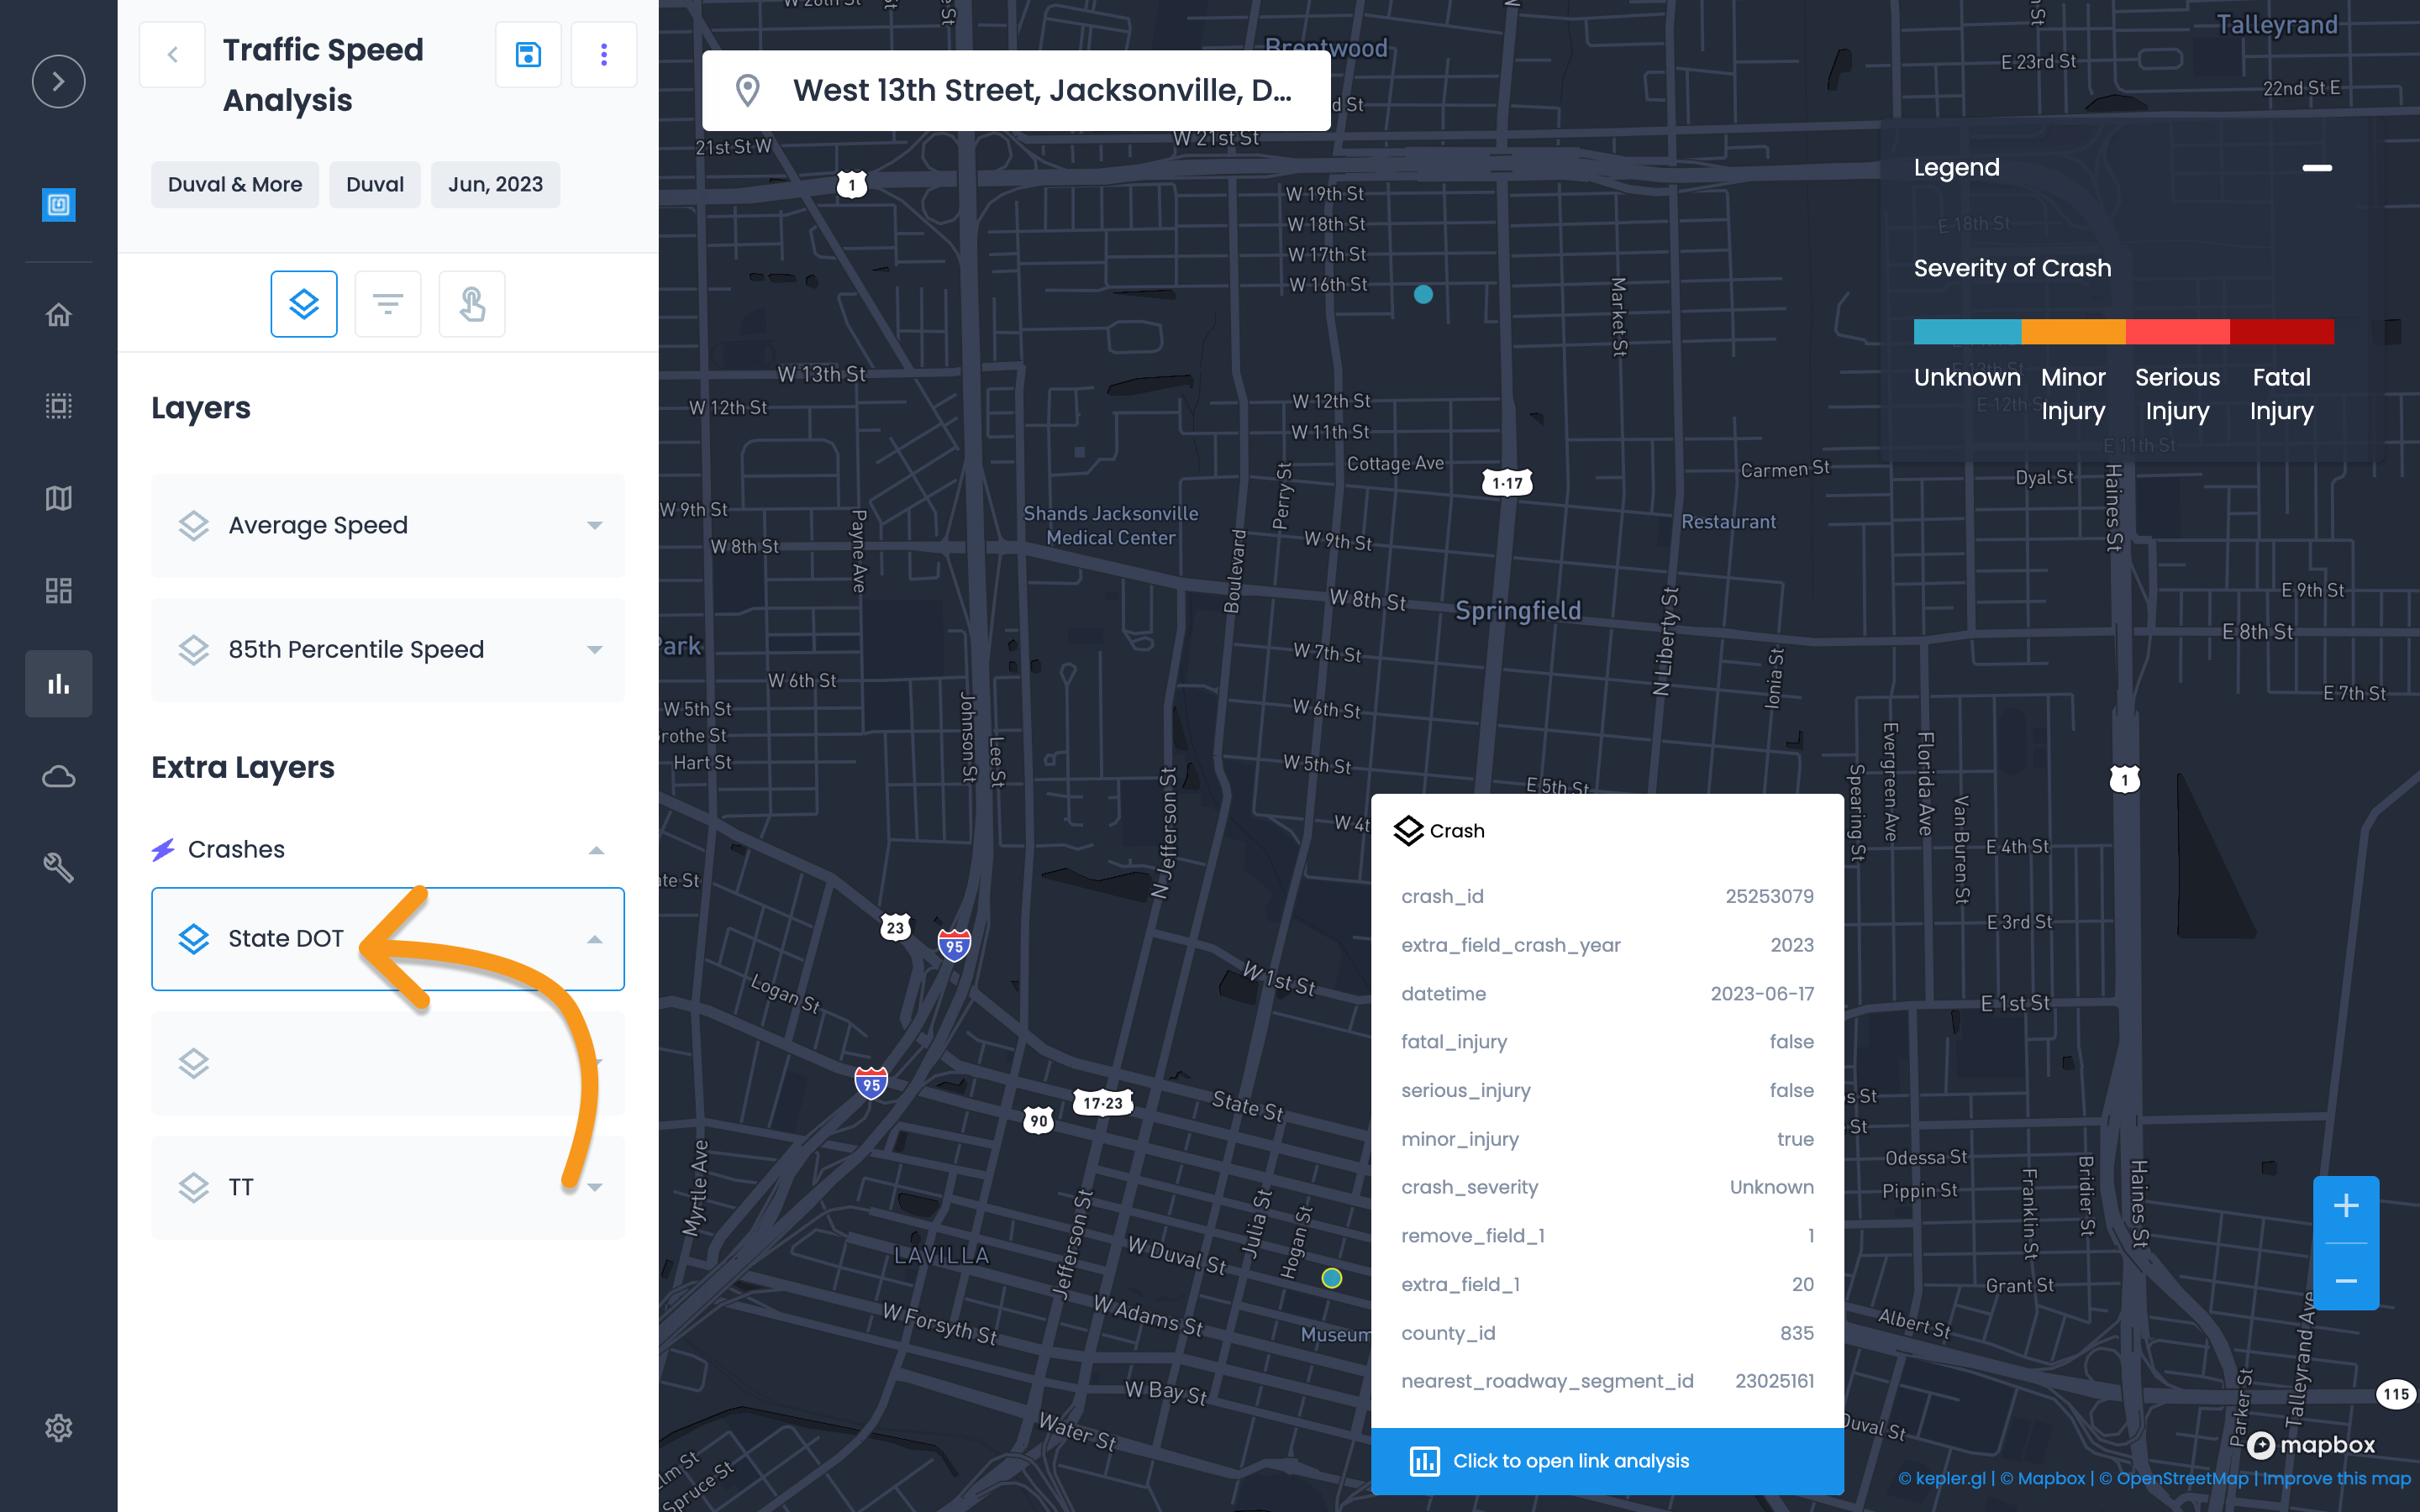
Once complete, the Crash Layer will display in Insights menu.
-
Create a new Insights report (https://portal.urbansdk.com/insights)
-
Turn on the Crash Layer to display Crash Locations on a Map
Crashes will only display during the selected Month of the Insights Report.
Create Custom Crash Maps in Studio
Once Crash Integration is complete, the file will be available to customize in Studio. To create a custom crash map:
-
Open Studio (https://portal.urbansdk.com/studio)
-
Select Add Data
-
Select Import from Data Hub
-
Search for the Crash Integration Name created during the import above.
-
Select the integration and import to display in a Studio map
-
Customize the Crash Style as desired.
Editing and Updating Crash Integration
You can edit or update the Crash Integration Name, Description and Data Source.
